
Figure 3. Changes in Hospital (Upper Panel) and Regional (Lower Panel) Effects on Mortality Between 2008 and 2012.
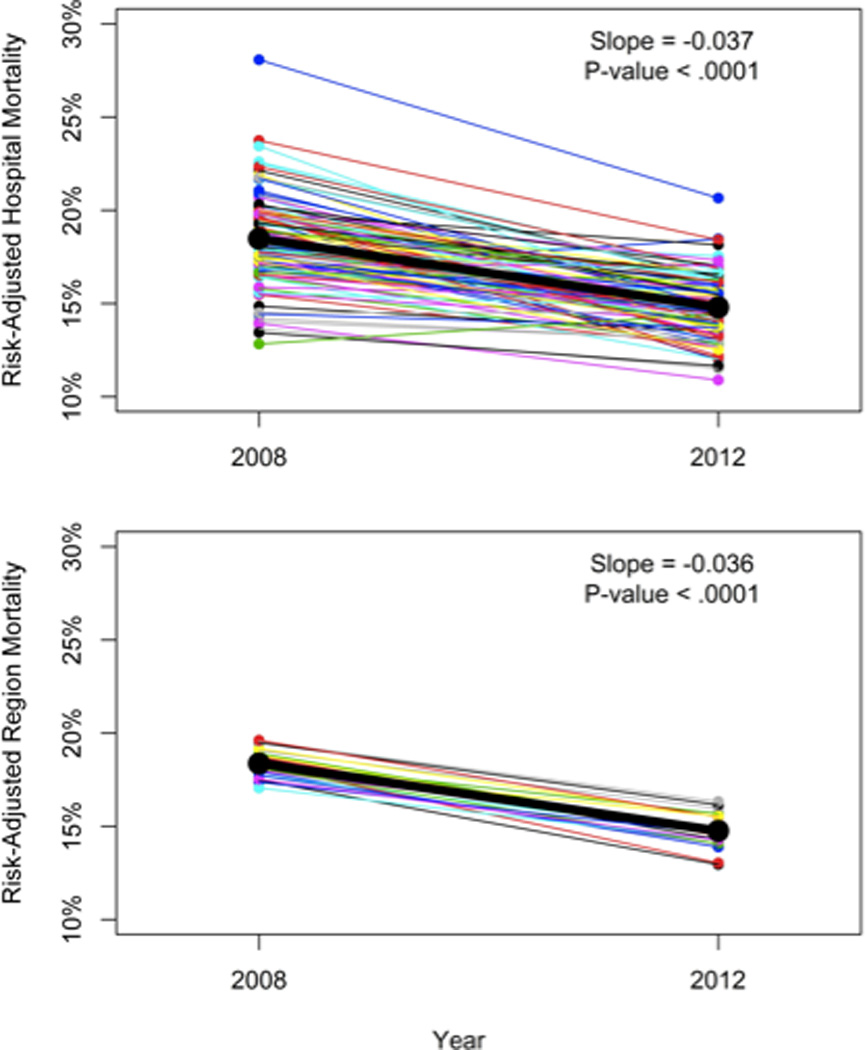
All results are risk- and reliability-adjusted. Each line segment connects the same organization at the 2 time points. Overall regression lines are depicted in bold, with slope and statistical significance listed in the upper right corner.