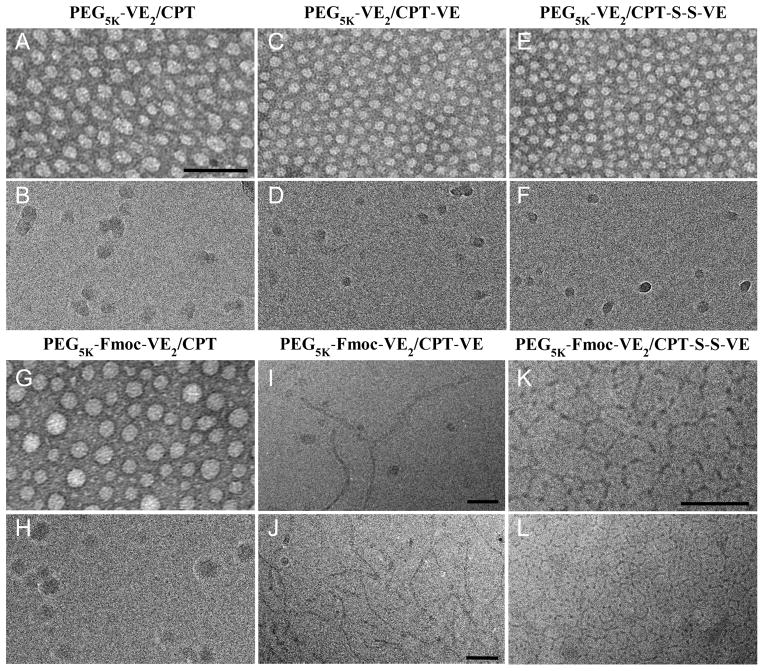
Fig. 1.
Electron microscopy imaging of PEG5K-VE2/CPT (A&B), PEG5K-VE2/CPT-VE (C&D), PEG5K-VE2/CPT-S-S-VE (E&F), PEG5K-Fmoc-VE2/CPT (G&H), PEG5K-Fmoc-VE2/CPT-VE (I&J), and PEG5K-Fmoc-VE2/CPT-S-S-VE (K&L). EM images in panel A, C, E, and G are from negatively stained samples. Panels B, D, F, H-L are cryoEM images recorded from frozen-hydrated samples. Panel I and K are enlarged views of J and L, respectively. All panels, except I-K, are at the same scale as in A. Scale bars, 100 nm in A&J, 50 nm in I&K.

