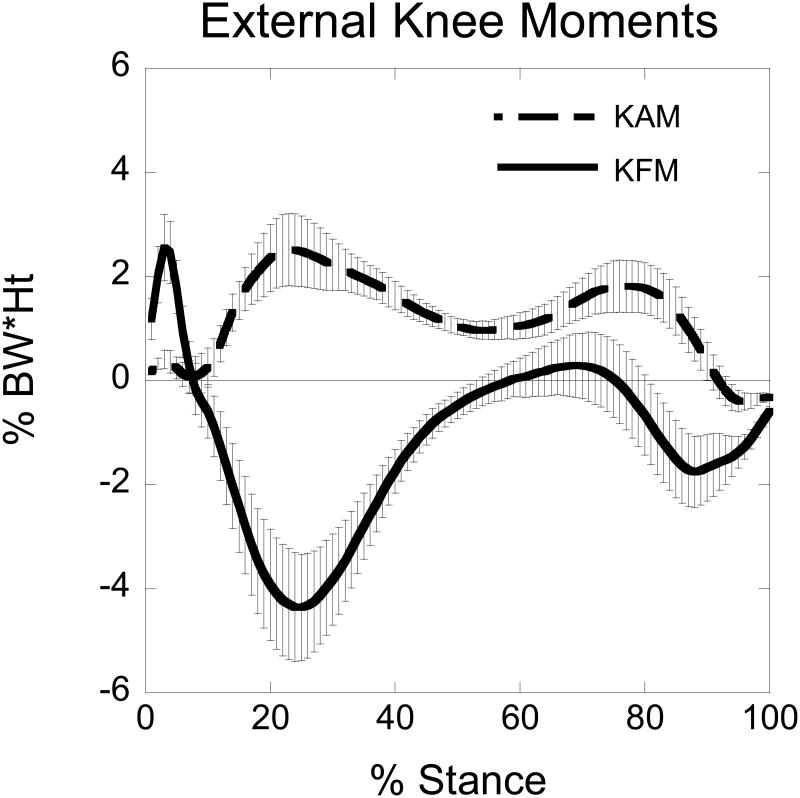
Figure 2.
Ensemble averaged external knee adduction (KAM) and flexor (KFM) moments for 10 subjects walking at a self-selected speed. The gray bars represent 95% confidence intervals. An increasing positive value for KAM indicates an increasing external knee adduction moment. A larger negative value for KFM indicates a larger external knee flexion moment. Note the timing of peak KAM and KFM was almost identical.

