
Fig. 3.
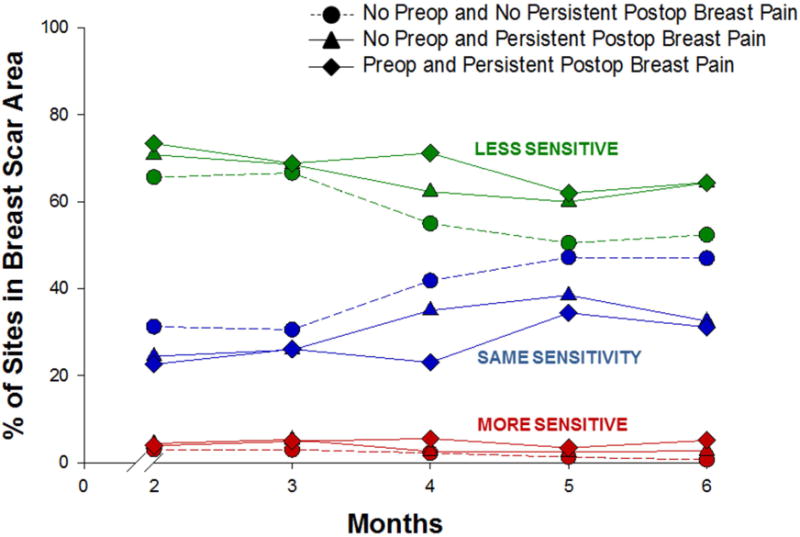
Plots of the estimated marginal means over time among the pain groups for the mixed effects model for the percentage of breast scar sites reported as less sensitive (green), the same (blue), and more sensitive (red) than the unaffected breast. Statistically significant findings: Percentage less sensitive – group effect: P = 0.04; time effect: P < 0.001; Percentage the same – group effect: P = 0.004; time effect: P = 0.001.