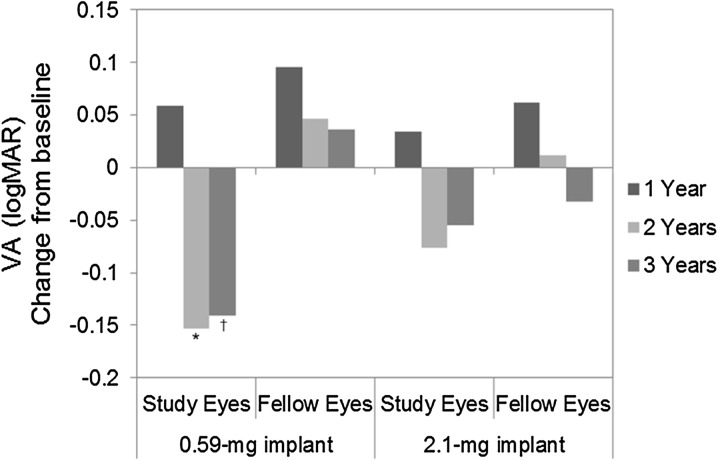
Fig. 2.
Change in best-corrected visual acuity from baseline up to 3 years post-implantation in the 0.59- and 2.1-mg implant groups. A negative value represents an improvement (P values from paired t test). *P < 0.0001. † P = 0.0007. logMAR logarithm of the minimum angle resolution, VA visual acuity

