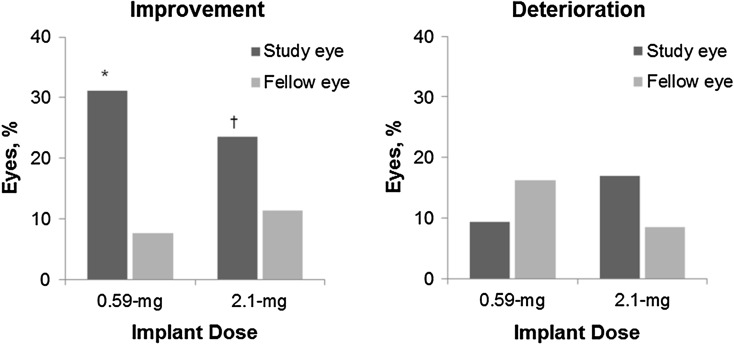
Fig. 3.
Proportion of eyes with an improvement (left panel) or deterioration (right panel) in visual acuity from baseline of at least 0.30 logMAR at 3 years in the 0.59- and 2.1-mg implant groups. (P values for the within-treatment comparison of study eye versus fellow eye). *P < 0.0001. † P = 0.0046. logMAR logarithm of the minimum angle resolution

