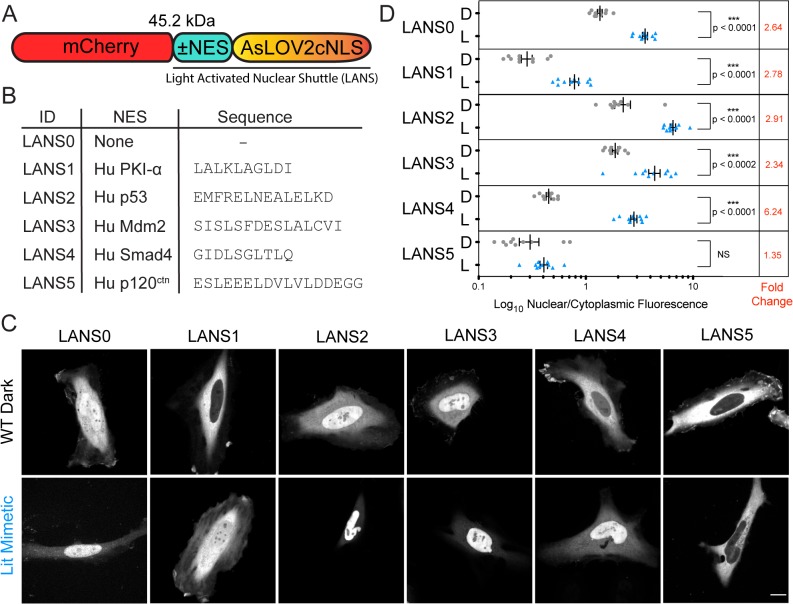
Fig 2. Confocal microscopy of LANS in HeLa cells.
(A) Schematic of the LANS constructs (B) List of the nuclear export signals tested. (C) Representative nuclear optical slices of cells used for the quantification of the nuclear/cytoplasmic distribution of the switch (scale bar = 15 μm). (D) Quantification of the effect of the nuclear export signal on the nuclear/cytoplasmic distribution of LANS (D—wild type construct imaged in the dark, L—lit mimetic I539E). Mean is reported ±SEM and statistical significance calculated with unpaired two-tailed t-students test; NS—Not Significant.

