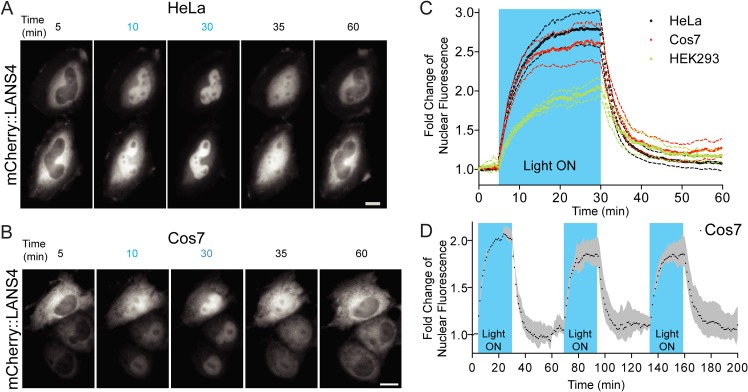
Fig 3. Real time light induced nuclear translocation of LANS4 in mammalian tissue culture cells.
(A) Representative images for light activation and reversion in HeLa cells and Cos7 (B) (scale bar = 25 μm); (c) Plotting the fold change of nuclear accumulations in HeLa, Cos7 and HEK293 (n = 4 each, mean reported ± SEM with dashed line). See also S1, S2 and S3 Movies. The blue shaded region indicates pulsed blue light activation (see Supplemental experimental procedures). (C) Multple activation reversion cycles in Cos7 (n = 2, mean reported ± SEM with shaded grey area). The blue shaded regions indicate pulsed blue light activation.

