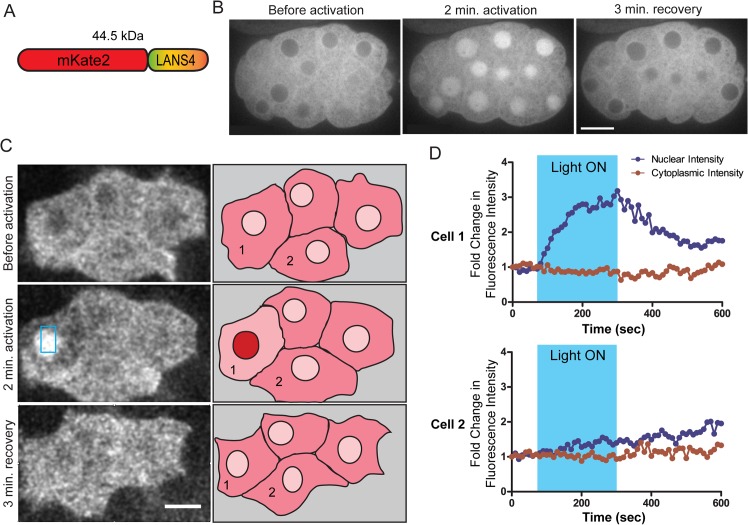
Fig 5. Light activated nuclear translocation in C. elegans embryo.
(A) Schematic of the mKate2::LANS construct that was expressed in C. elegans embryos (B) Confocal images of an embryo expressing mKate2::LANS ubiquitously and subjected to photoactivation with blue light. Scale bars represent 10 μm. See also S4 Movie. (C) Left: Confocal images of four mKate2::LANS expressing MS lineage cells on the ventral surface of a late gastrulation-stage embryo. The blue box in the center image indicates the region that was photoactivated with blue light. Brightness and contrast were adjusted to compensate for photobleaching. Scale bar represents 5 μm. Right: Sketches summarizing the observed localization. Numbers correspond to the cell numbers in (D). See also S5 Movie. (D) Quantification of nuclear and cytoplasmic fluorescence intensities as a function of time for the two cells labelled in (C). Cell 1 was illuminated with blue light, and Cell 2 is a neighboring cell. These measurements were corrected for photobleaching (see materials and methods).

