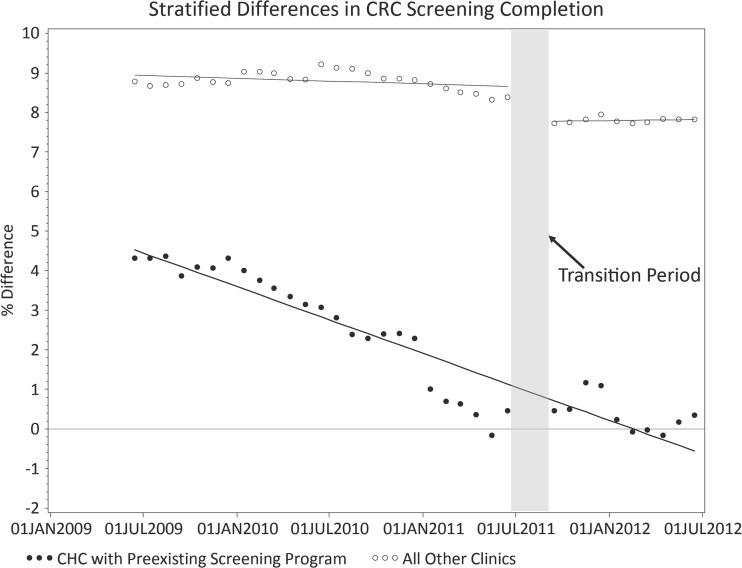
Figure 2.
Differences in CRC Screening by educational attainment, stratified by presence of CRC screening program in clinic prior to TopCare. Dots/circles represent actual measured colorectal cancer screening rates at each time point. A line plotting the regression equation derived from the interrupted time series analysis is superimposed.

