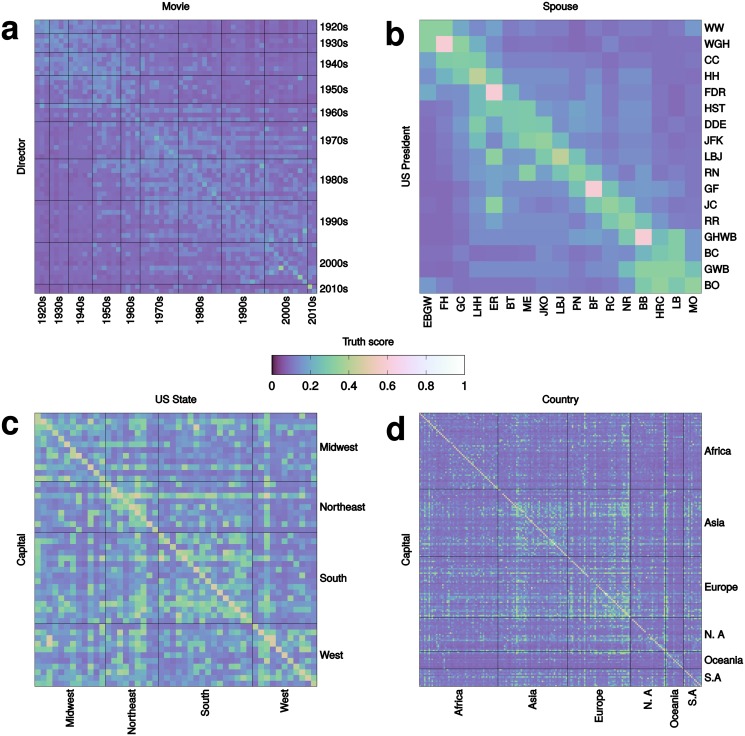
Fig 3. Automatic truth assessments for simple factual statements.
In each confusion matrix, rows represent subjects and columns represent objects. The diagonals represent true statements. Higher truth values are mapped to colors of increasing intensity. (a) Films winning the Oscar for Best Movie and their directors, grouped by decade of award (see the complete list in the S1 Text). (b) US presidents and their spouses, denoted by initials. (c) US states and their capitals, grouped by US Census Bureau-designated regions. (d) World countries and their capitals, grouped by continent.

