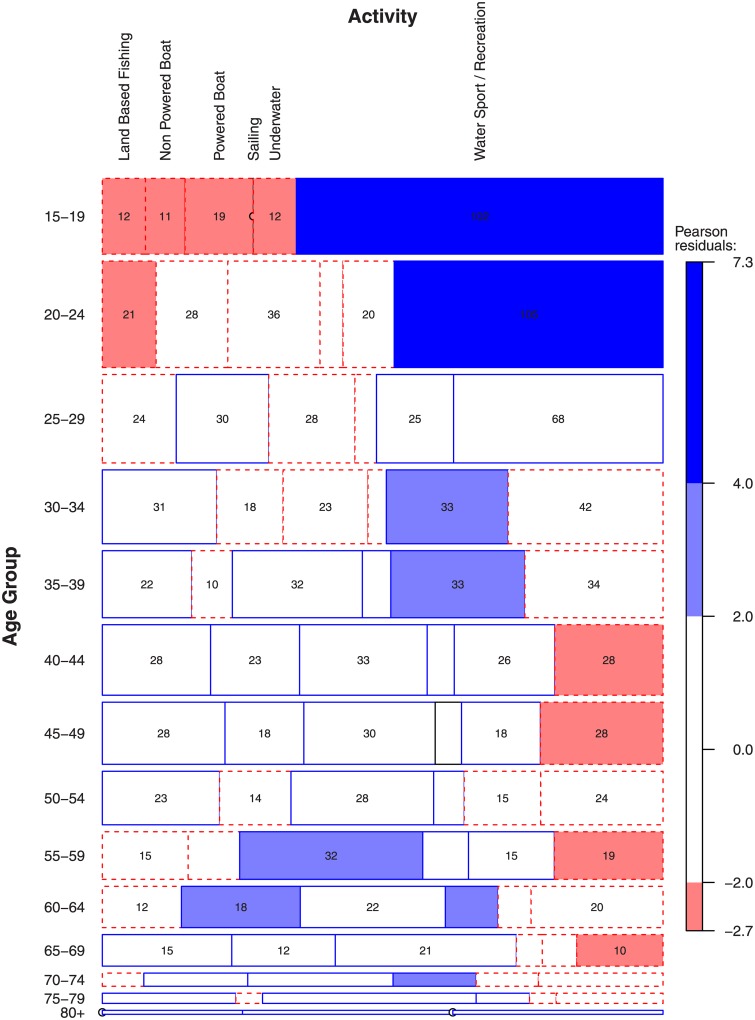
Fig 1. Age group affects the type of activity that precedes drowning.
The size of a cell represents the frequency of drowning deaths given the factors listed around the edges of the plot (e.g., Activity and Age Group when alcohol was/was not involved). The boundary line of the cells indicate whether the cell is larger (solid line) or smaller (dashed line) than expected if the factors were independent. The size of residuals determines the lightness of a cell: very dark grey for large residuals (> 4, corresponding to α = 0.0001), lighter grey for medium sized residuals (< 4 and > 2), white for small residuals (< 2, corresponding to α = 0.05). For example, the data for 15–19 year olds under the Water Sport / Recreation category has a colour intensity greater than 4 and a boundary line. This indicates that the proportion of cases in this category is greater than expected for this age group.

