
Figure 10.
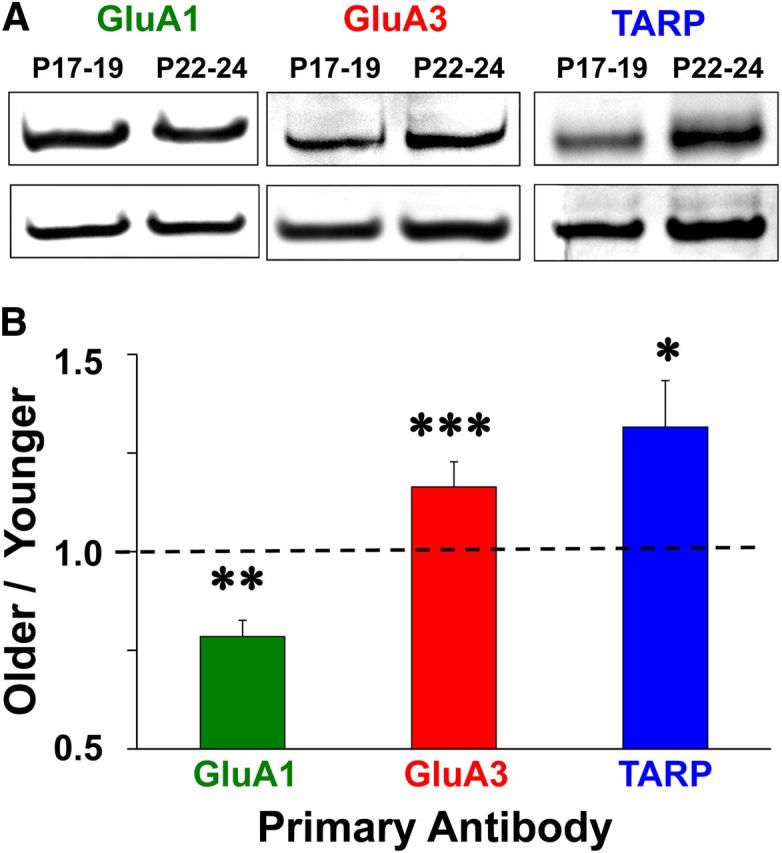
Western blot images and group averages. Protein was extracted from whole hippocampal homogenates at P17–P19 and P22–P24 and probed with α-GluA1, α-GluA3, α-Stargazin, or α-actin primary antibody. A, Photos of GluA1, GluA3, and TARP bands with actin controls in blots containing protein samples collected at P17–P19 and P22–P24. B, Older/Younger ratio means for normalized band intensities. Asterisks represent significant group differences: *p < 0.05, **p < 0.02, ***p < 0.01.