Figure 4.

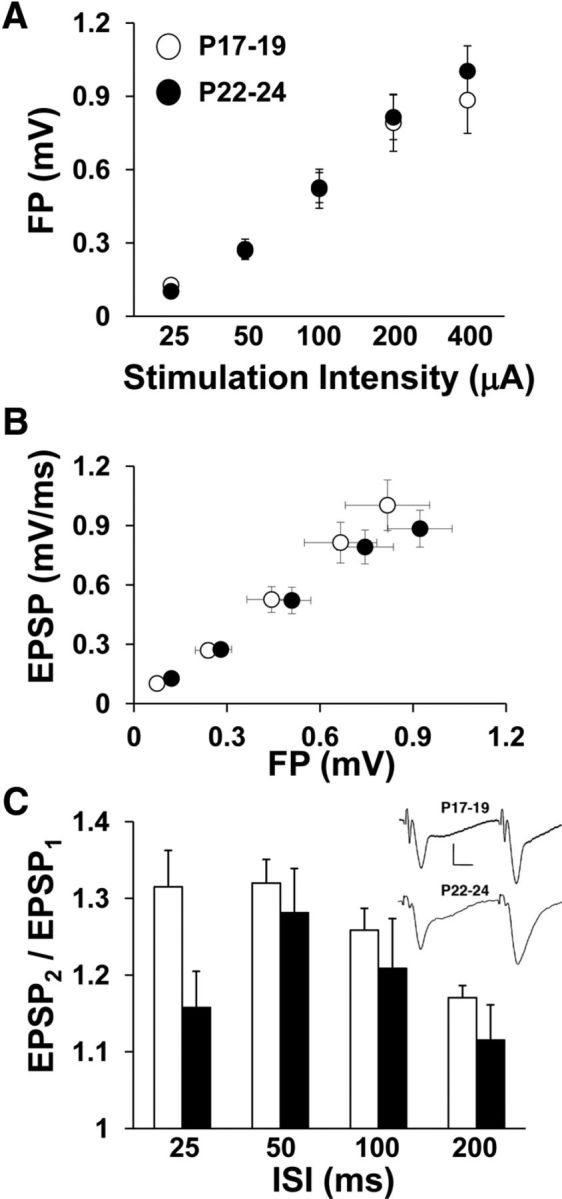
Baseline I/O and ISI curves for electrically evoked field responses recorded from stratum radiatum of area CA1 in hippocampal slices. A, Average FP amplitude is plotted against stimulation intensity for both age groups. The FP amplitude increased with increasing stimulation intensity (two-way repeated-measures ANOVA: p < 0.0001). B, Average EPSP slope is plotted against mean FP amplitude for both age groups. EPSP slope increased across FP levels (two-way repeated-measures ANOVA: p < 0.0001). C, The ratio of the test EPSP slope to the conditioning EPSP slope (PPF) is plotted against ISI for both age groups. PPF was altered as a function of ISI (two-way repeated-measures ANOVA: p < 0.0001), but not age. Inset shows averaged traces (10 sweeps each) from one experiment at 50 ms ISI for each age group. Scale bars, 10 ms and 0.5 mV. Number of slices per group ranges from 19 to 25.
