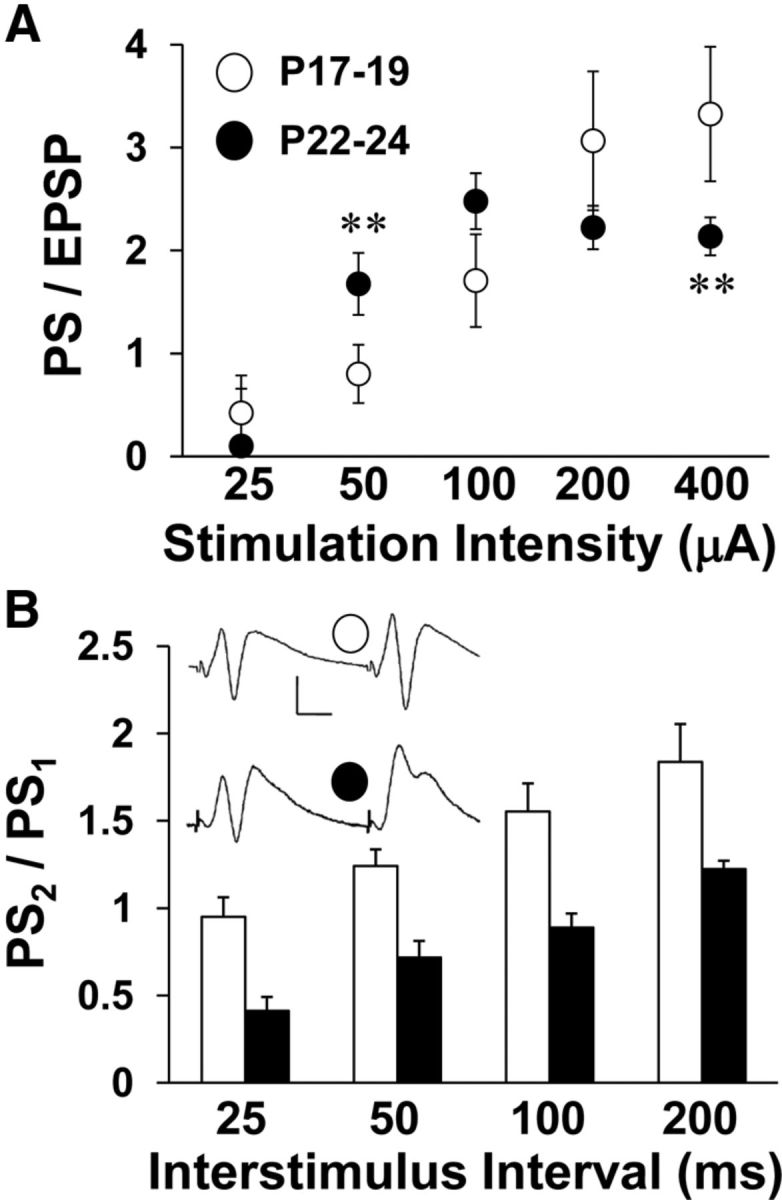
Figure 5.

Baseline I/O and ISI curves for electrically evoked field responses recorded in stratum pyramidale of hippocampal slices. Stimulation intensity and paired-pulse ISIs were varied. A, Average PS to EPSP ratio is plotted against stimulation intensity for both age groups. Asterisks represent significant group differences: **p < 0.01. B, Ratio of the test PS amplitude to the conditioning PS amplitude is plotted against ISI for both age groups. Inset shows averaged traces (10 sweeps each) from one experiment at 50 ms ISI for each age group. Scale bars, 10 ms and 0.5 mV. Number of slices per group ranges from 20 to 25.
