Figure 6.
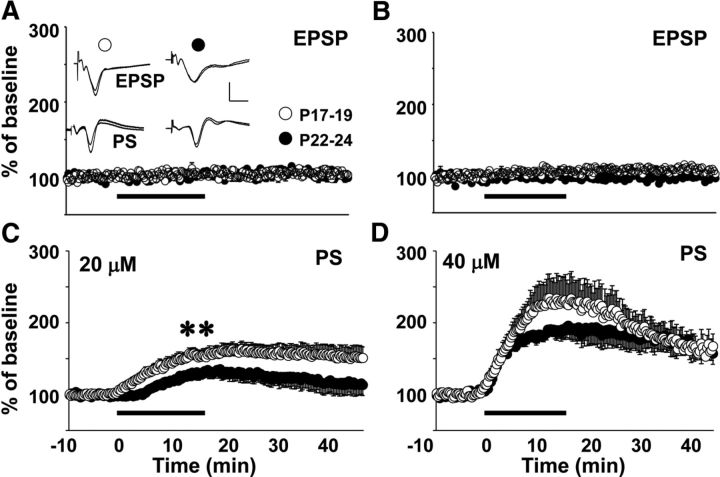
Effects of CX614 on EPSP slope and PS amplitude at P17–P19 and P22–P24. Stimulating and recording electrodes were placed the same as for I/O and ISI experiments. Timelines display normalized EPSP slope (A, B) and PS values (C, D) during baseline, drug exposure, and washout. Drug delivery is indicated by a solid bar below the timelines (A, C, 20 μm; B, D, 40 μm). Inset in A shows overlaid averaged traces (10 sweeps each) taken during baseline and 20 μm drug exposure. Scale bars, 1 mV, 10 ms. Asterisks represent significant group differences: **p < 0.01. Number of slices per group ranges from 9 to 20.

