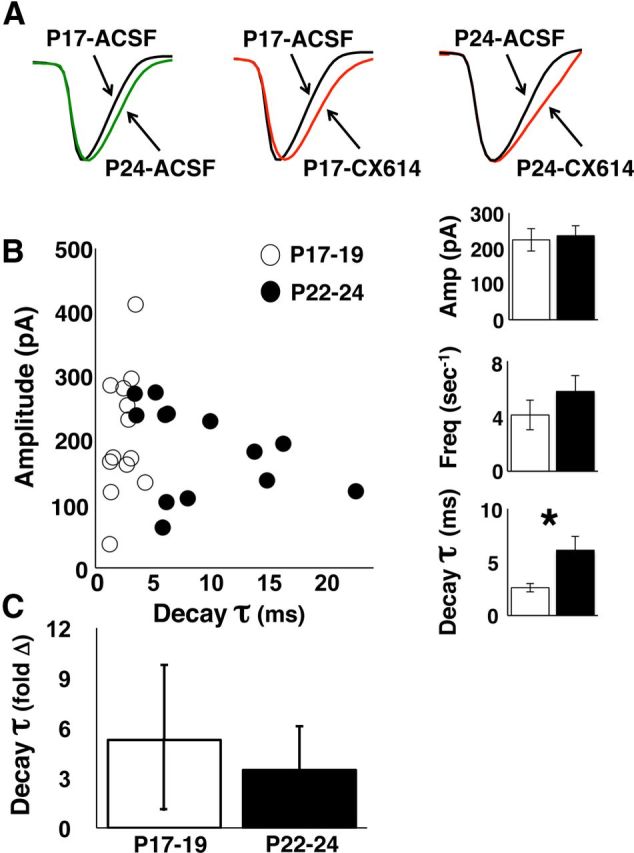
Figure 8.

Whole-cell intracellular AMPAR mEPSCs are prolonged with increasing age at the end of the third postnatal week. A, Averaged scaled mEPSC waveforms (100 mEPSC traces per waveform) compared across age groups (left) and compared across baseline and drug exposure for each age group (middle, right). B, Averaged baseline mEPSC peak amplitude plotted against average τ for each cell. Bar graphs at right show group means for peak amplitude (Amp), mEPSC frequency (Freq, mEPSCs/s), and τ during baseline. Only τ differs across age groups (Bonferroni: p < 0.05). C, Averaged normalized (change from baseline, fold change) mEPSC τ during 20 μm CX614 exposure at P17–P19 and P22–P24. Number of cells is 13 per age group.
