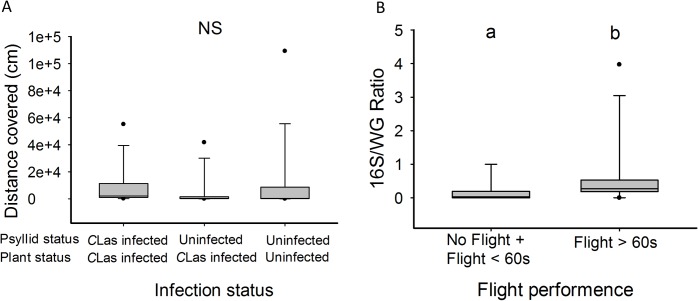
Fig 3. Flight performance of D. citri depending of CLas exposure and infection.
(A) Distance covered by psyllids on the flight mill depending on their infection status and the infection status of the rearing plants, as determined by qPCR. (B) Ratio between 16S and Wg genes depending on flight performance of psyllids on the flight mill. The ratio of 16S/WG increased proportionally with CLas DNA quantified in individual D. citri. The 16S/WG was significantly higher in infected D. citri that performed long flights (> 60s) than in infected D. citri that did not fly or performed short flights (< 60s) (P = 0.033, Kruskal-Wallis). A line within each boxplot indicates the median for each treatment and symbols above each boxplot indicate outliers.

