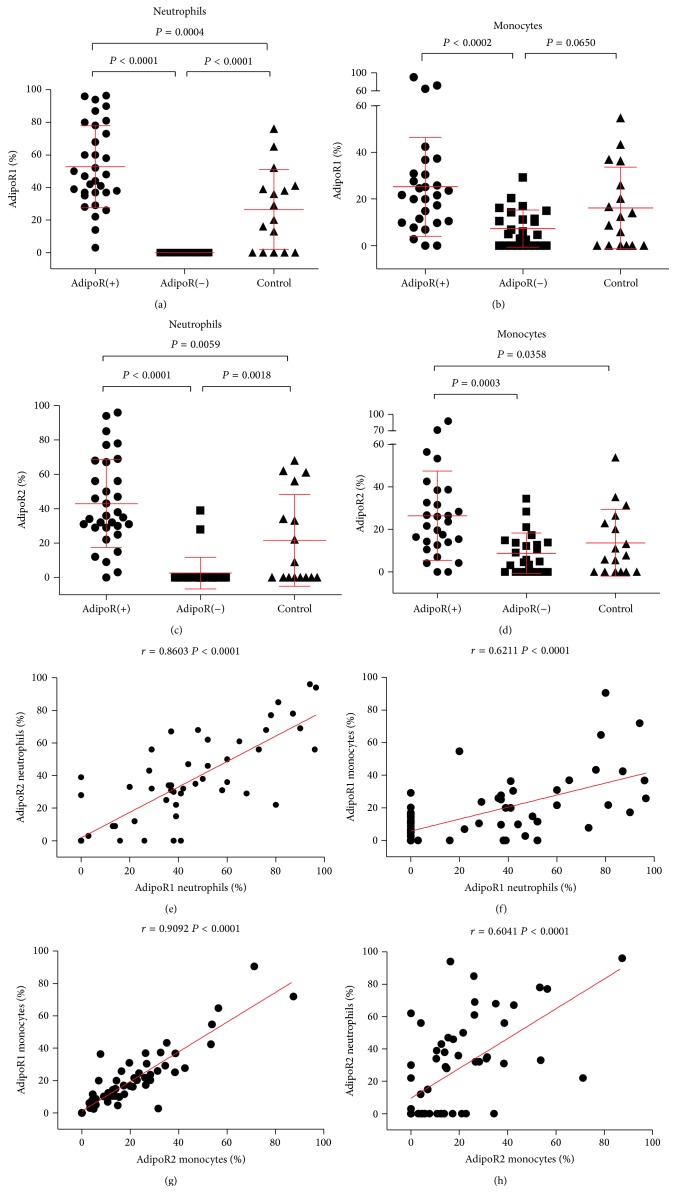
Figure 1.
Expression and correlations of AdipoR on neutrophils and monocytes in PH children and normotensive control. The summary of analyses of AdipoR1 and AdipoR2 expression in neutrophils and monocytes in PH children (AdipoR(+) and AdipoR(−)) and normotensive control. (a) Percentage of neutrophils showing AdipoR1 receptor expression (AdipoR1%). (b) Mean levels of AdipoR1 receptor expression (AdipoR1%) in monocytes. (c) Percentage of neutrophils showing AdipoR2 receptor expression (AdipoR2%). (d) Mean levels of AdipoR2 receptor expression (AdipoR2%) in monocytes. All results (a–d) presented as means ± SD. AdipoR(+), n = 31, AdipoR(−), n = 26, controls, n = 19. (e) Correlations between AdipoR1 and AdipoR2 surface expression levels in neutrophils. (f) Correlations between the percentage of AdipoR1-positive neutrophils and AdipoR1-positive monocytes. (g) Correlations between the percentage of monocytes showing expression of AdipoR1 and AdipoR2. (h) Correlations between the percentage of AdipoR2-positive neutrophils and AdipoR2-positive monocytes.

