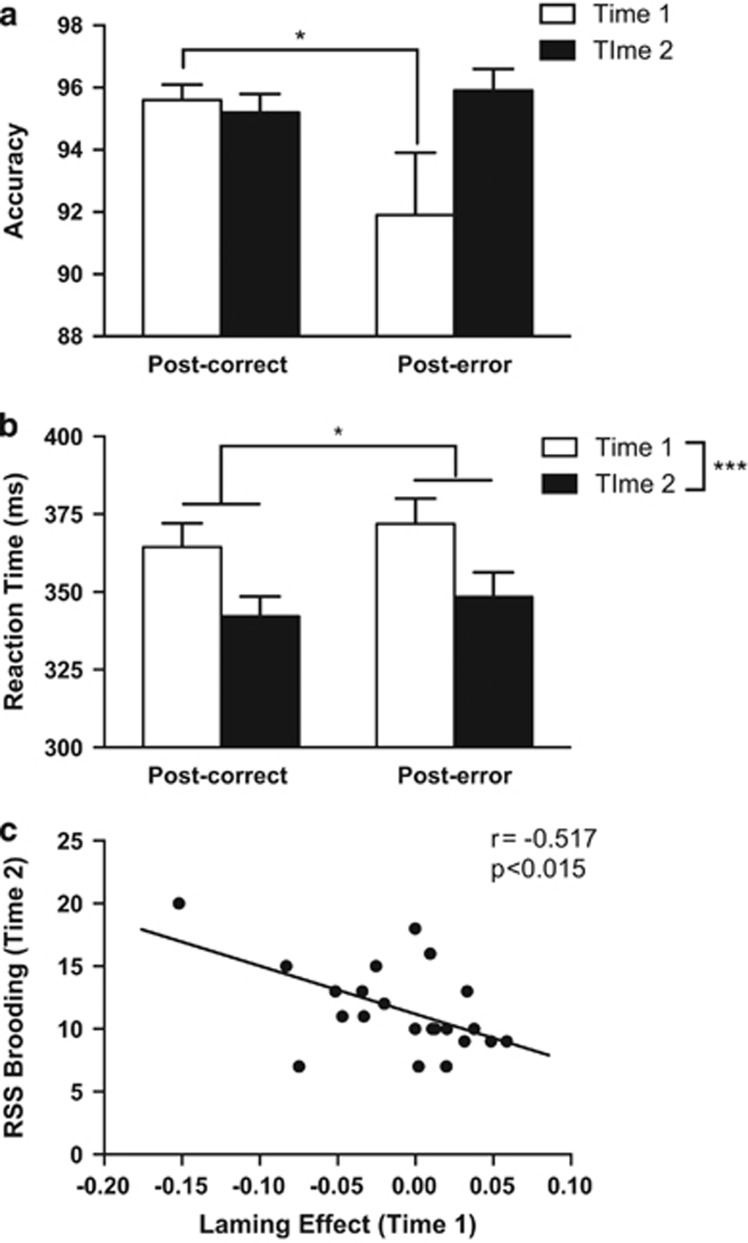
Figure 1.
Post-correct and post-error (a) accuracy and (b) reaction time scores (in ms) at Time 1 (first day of admission to treatment program) and Time 2 (post treatment) for patients. *P<0.05, ***P<0.001, post hoc t-tests. (c) Correlation between Time 1 post-error accuracy and Time 2 RRS (Ruminative Responses Scale) brooding.

