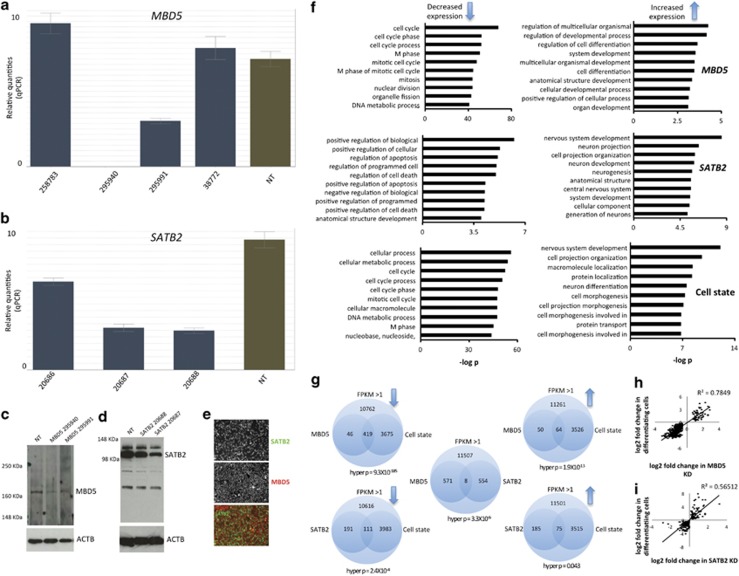
Figure 1.
Generation of human neural stem cell (NSC) models of MBD5 and SATB2 suppression, and RNAseq comparative analysis. (a) MBD5 gene-expression analysis in four cell lines that underwent MBD5 shRNA lentiviral infection (blue bars). Numbers represent RNAi consortium (TRC) identifiers. Green bar represents mean MBD5 expression across four independent non-target (NT) control cell lines. (b) SATB2 gene-expression analysis in three independent cell lines (blue bar) and four independent non-target controls (green bar). (c) Western blot experiment showing the two MBD5 KD cell lines with greatest degree of KD from a and one NT control, targeting LacZ mRNA. MBD5 is detected at ~168 KDa. (d) Western blot analysis of SATB2 knockdown in LacZ and two SATB2 KD cell lines. (e) Immunocytochemical analysis of MBD5 and SATB2 protein demonstrating presence of both proteins in all cells, with a cytoplasmic distribution of MBD5 and nuclear localization of SATB2 protein. (f) Gene ontology analysis of differentially expressed mRNA in MBD5 KD, SATB2 KD and the cell state experiment (non-target proliferating cells compared with non-target differentiating cells). (g) Statistical analysis of the probability of observing overlapping significantly differentially expressed mRNA across each experiment. (h) mRNAs that overlap in MBD5 KD proliferating cells and non-target differentiating cells are correlated. (i) mRNAs that overlap in SATB2 KD proliferating cells and non-target differentiating cells are correlated. KD, knockdown; MBD, methyl-CpG binding domain; mRNA, messenger RNA; SATB, special AT-rich binding protein.

