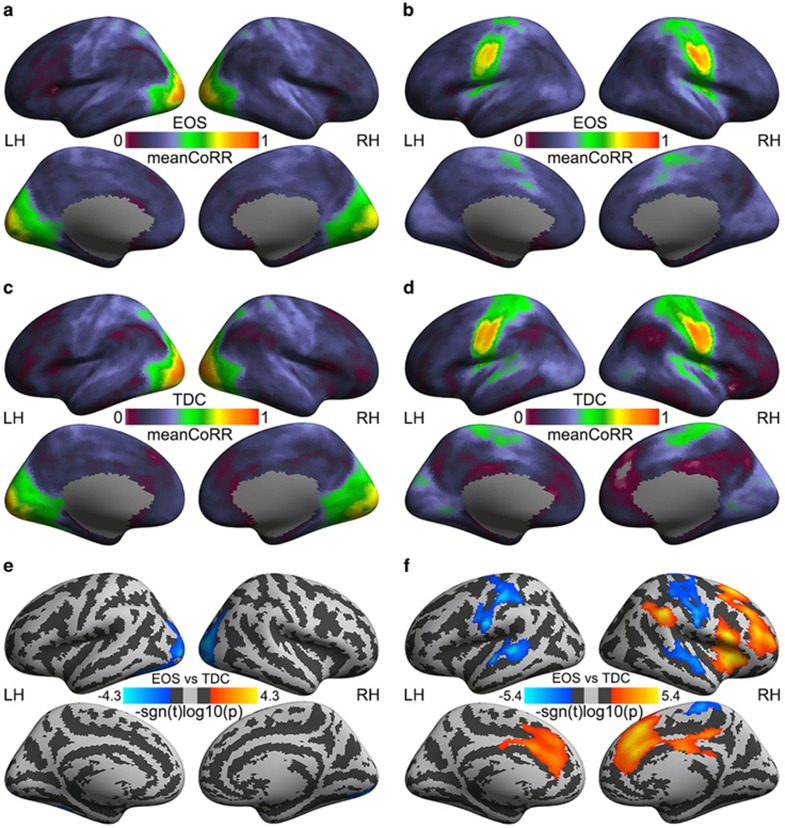
Figure 2.
Mapping remote functional connectivity in early-onset schizophrenia (EOS) and typically developing controls (TDCs). Group mean correlation maps of two regions of interest as seeds (left column, left middle occipital cortex, MOC; right column, right postcentral gyrus, PosCG) are depicted for EOS patients (a, b) and TDC (c, d). Group differences in Fisher z-transformed correlations are compared between EOS and TDC (e, f). The vertex-wise significance of group comparisons is measured with signed log10-transformed P-values and is rendered onto the cortical surfaces of the left hemisphere (LH) and the right hemisphere (RH). These inflated surfaces are defined by FreeSurfer as the fsaverage5 surface model and visualized from lateral and medial views. Light-gray colors indicate the position of a cortical gyrus, whereas dark-gray colors show the position of a cortical sulcus.

