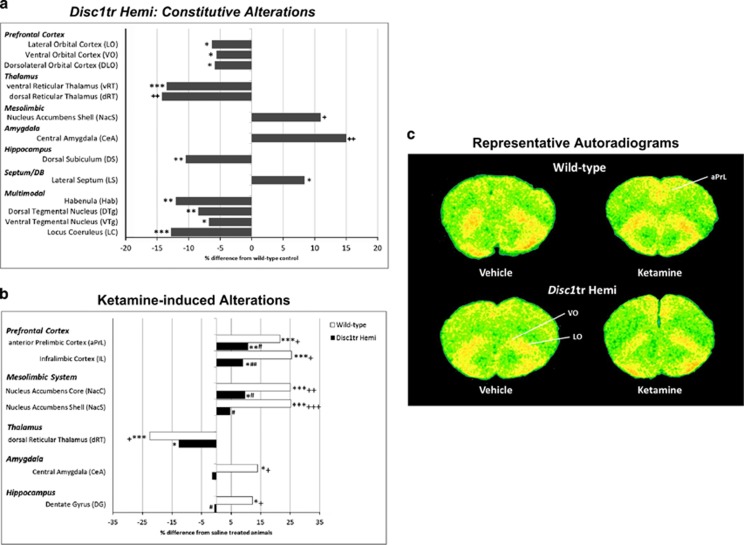
Figure 1.
Altered constitutive cerebral metabolism and an attenuated metabolic response to ketamine treatment in Disc1tr Hemi mice. (a) Data shown as % difference in LCGU in Disc1tr Hemi mice relative to Wt littermates. *P<0.05, **P<0.01 and ***P<0.001, significant effect of genotype (main effect, two-way ANOVA (% difference between pooled saline and ketamine treatment groups)). +P<0.05 and ++P<0.01, significant genotype effect in a brain region where a significant genotype × treatment effect was found by two-way ANOVA (pairwise t-test with Bonferroni–Holm correction, significant between saline-treated animals of the different genotypes (% difference between saline-treated animals shown)). (b) Ketamine-induced alterations in cerebral metabolism are attenuated in Disc1tr Hemi mice. +P<0.05, ++P<0.01 and +++P<0.001, significant genotype × treatment interaction as determined by two-way ANOVA. *P<0.05, **P<0.01 and ***P<0.001, a significant effect of ketamine within genotype (t-test with Bonferroni-Holm post hoc correction). #P<0.05 and ##P<0.01, significant difference between ketamine-treated animals of the different genotypes (t-test with Bonferroni–Holm correction). (c) Representative pseudocolor autoradiograms from saline- and ketamine-treated Disc1tr Hemi animals and their Wt littermates. Warmer colors (red/yellow) denote increased levels of metabolism and colder colors (green/blue) denote lower levels of metabolism. Full data for constitutive and ketamine-induced alterations in LCGU are shown in the Supplementary Tables S2A–F. ANOVA, analysis of variance; LCGU, local cerebral glucose utilization; Wt, wild type.

