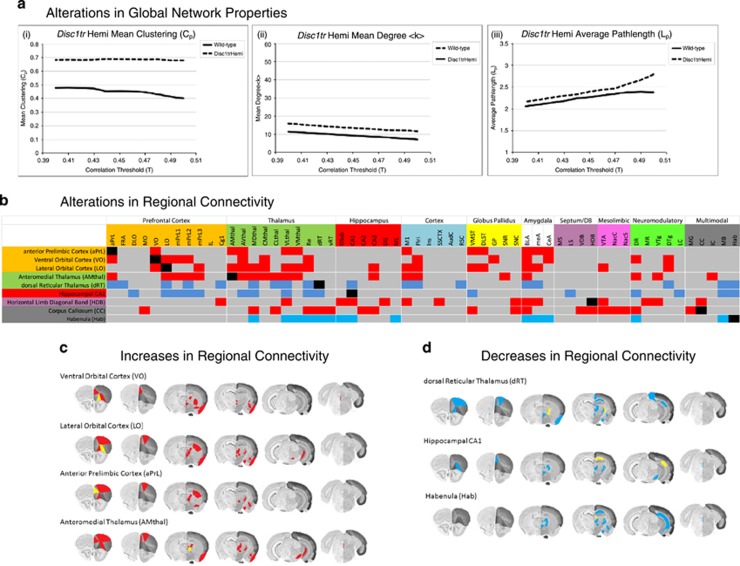
Figure 2.
Disc1tr Hemi mutation-induced alterations in functional brain network properties and regional functional connectivity. (a) The mean clustering coefficient was significantly increased (Cp; A(i), P=0.039) in the functional brain network of Disc1tr Hemi mutant mice. Mean degree (<k> A(ii)) and average path length (Lp; A(iii)) are not significantly altered in the functional brain networks of Disc1tr Hemi mice. Significance was determined by comparison of the difference for each measure in the real networks relative to 55 000 random permutations of the real data across the entire correlation threshold range. (b) Heatmap showing how Disc1tr Hemi mutation alters the functional connectivity of 'seed' brain regions; in this case 'seed' regions (aPrL, LO, VO, AMthal, dRT, CA1, HDB and CC) were those found to have altered importance in the functional brain network as defined through centrality analysis. Red denotes a significant increase in functional connectivity of the seed region to a given region, whereas blue denotes a significant decrease in functional connectivity, as determined by statistical comparison of the variable importance to the projection statistic (t-test with Bonferroni post hoc correction) determined through PLSR analysis. Significance was set at P<0.05. Full data for each 'seed' region are shown in the Supplementary Tables S4–S12. (c) Brain images showing the anatomical localization of brain regions with significantly increased connectivity to selected prefrontal and thalamic 'seed' brain regions (aPrL, LO, VO and AMthal). Yellow denotes the anatomical localization of the 'seed' brain region and red denotes a significant increase in connectivity with the defined 'seed' region. (d) Brain sections showing the anatomical localization of brain regions with significantly decreased connectivity to selected 'seed' brain regions (dRT, CA1 and Hab). Yellow denotes the anatomical localization of the 'seed' brain region, blue denotes a significant decrease in connectivity with the defined 'seed' region. Brain section figures are modified from the Allen mouse brain atlas (mouse.brain-map.org/static/atlas). PLSR, partial least squares regression.

