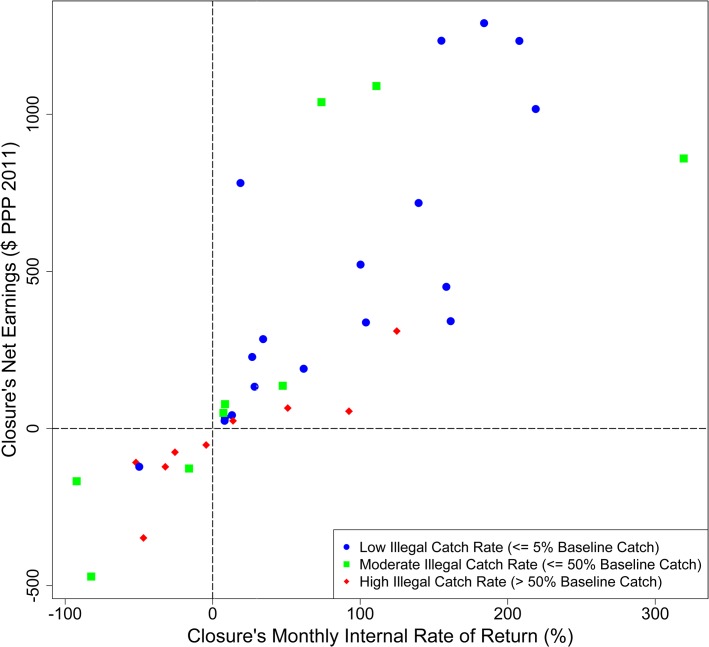
Fig 5. Net Economic Benefits of Closures.
Site-specific Net Earnings (NE) and Internal Rate of Return (IRR) of 36 local closures, 2004–2011, using site-based cost model. Point coding represents rates of illegal fishing during the closures: Low (< = 5% of baseline ‘before’ catches, blue circles), Moderate (< = 50% of baseline catches, green squares), and High (>50% of baseline catches, red diamonds). Data points represent median values across 1000 model runs.

