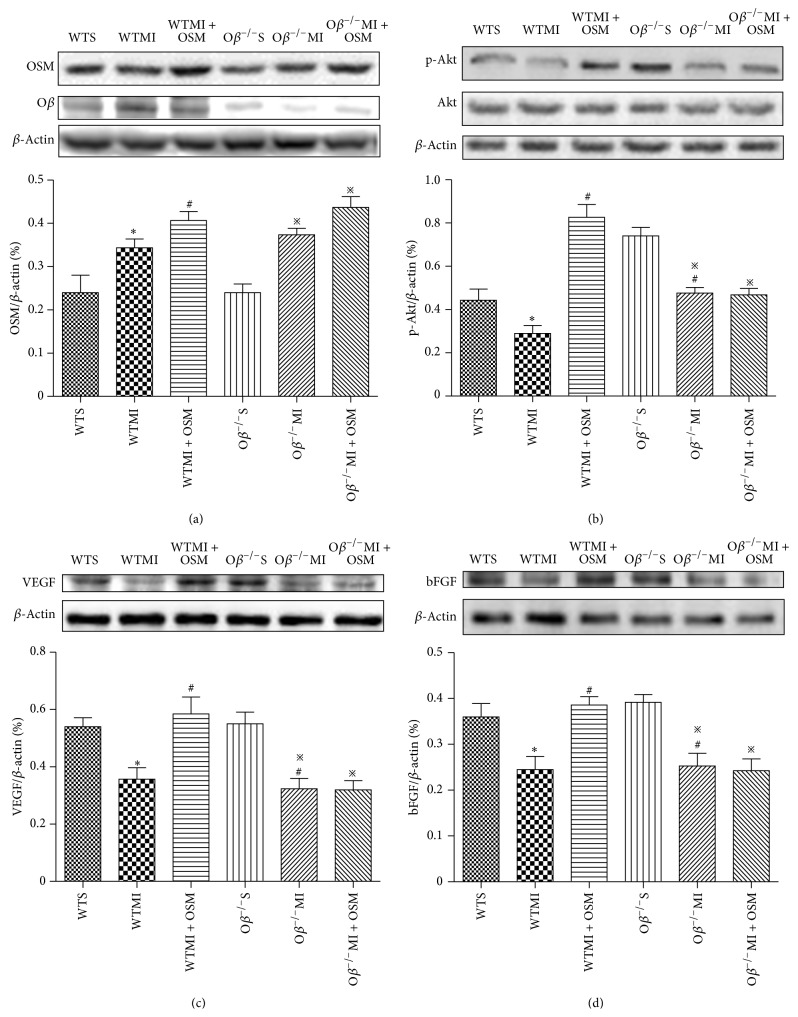
Figure 6.
OSM increased levels of p-Akt, VEGF, and bFGF in ischemic myocardium. (a) Western blot analysis of the expressions of OSM in different groups of mice. (b) Western blot analysis of the levels of p-Akt and Akt in six groups. (c) Western blot analysis of the expression of VEGF in different groups of mice. (d) Western blot analysis of the expression of bFGF in the six groups of mice. The values are means ± SD. * P < 0.05 versus WT group, # P < 0.05 versus WT + MI group, and ※ P < 0.05 versus Oβ −/−S group. N = 6 in each group.

