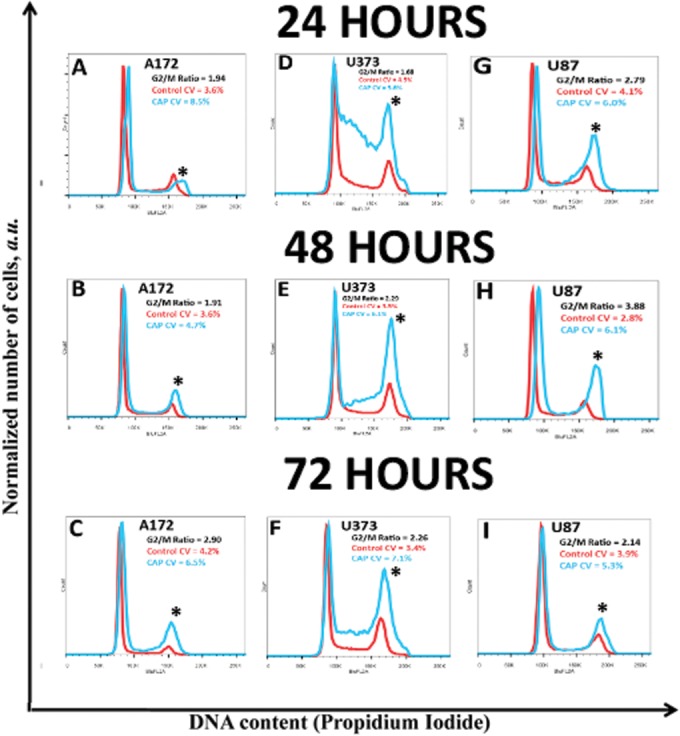
Fig 7. Determination of the cell cycle effect induced by CAP treatment in each glioma cell line.

Briefly, each of the glioma cells were treated with 90s CAP, and DNA content was measured at 24, 48, and 72 hours post-CAP treatment. In A172, CAP treatment for 90s resulted in a significant G2/M arrest at (B) 48 and (C) 72 hours, but not at (A) 24 hours. In U373, 90s CAP treatment resulted in a significant increase in the S-phase and G2/M population at (D) 24 hours and sustained at (E) 48 and (F) 72 hours. In U87, CAP treatment for 90s resulted in a significant increase in the G2/M population at (G) 24 and (H) 48 hours that diminished by (I) 72 hours. * denotes statistical significance compared to control (P <0.05).
