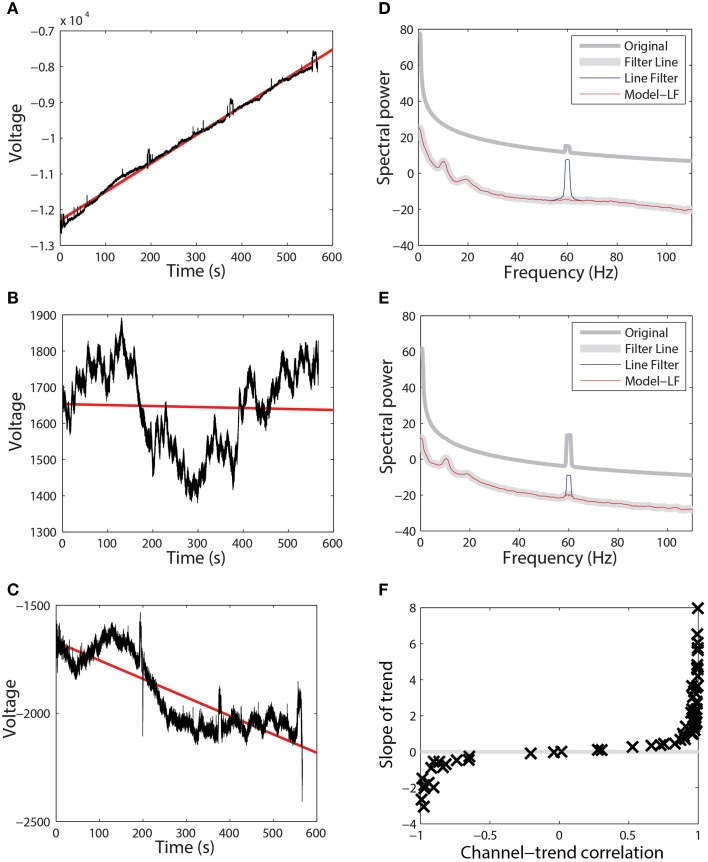
Figure 2.
Raw data from three channels taken from a single session recorded using a 64-channel Biosemi headset. Voltages are in units of microvolts. Spectral power is calculated in units of . (A) A channel that is highly correlated (0.997) with its linear trend line (shown in red). (B) A channel that is weakly anti-correlated (−0.039) with its linear trend line (shown in red). (C) A channel that is anti-correlated (−0.838) with its linear trend line (shown in red). (D) Power spectrum of the channel shown in (A). Medium gray line corresponds to the spectrum of original data. Thick gray line corresponds to data high-pass filtered at 0.3 Hz followed by line noise removal. Blue line corresponds to data cleaned of line noise then high-pass filtered at 0.3 Hz. Red line corresponds to data where line noise removal and subsequent filtering are applied after removal of the global best-fit linear trend. (E) Power spectrum of channel shown in (B) shown as in part (D). (F) Correlation of all of the channels in this dataset with their best-fit line vs. the slope of that best-fit line.

