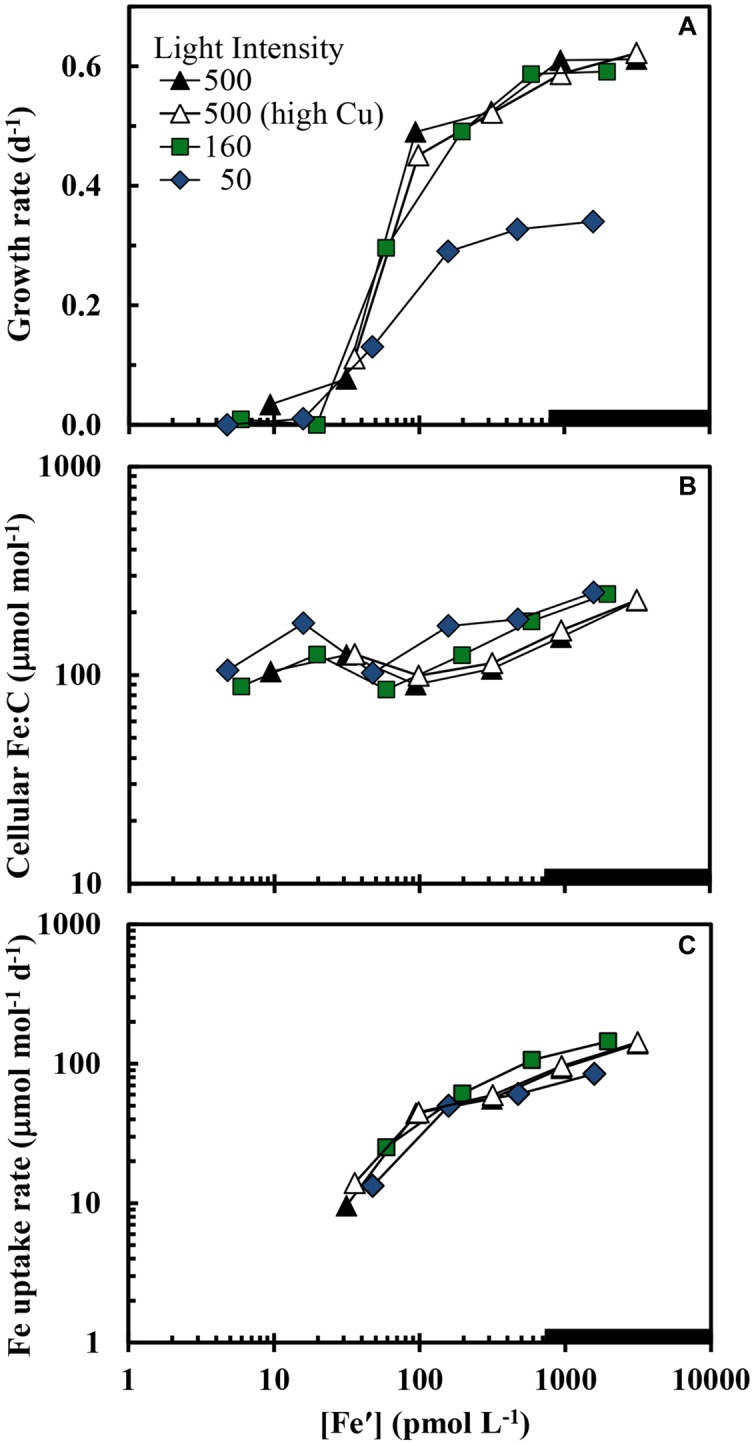
FIGURE 1.

(A) Specific growth rate, (B) cellular Fe:C ratio, and (C) carbon normalized cellular iron uptake rate (μmol [mol C]-1 d-1) in Synechococcus bacillaris plotted as functions of the average daily concentration of dissolved inorganic ferric hydrolysis species ([Fe′]) in picomolar (pM) units. There were four separate treatments: (1) high light intensity (500 μmol quanta m-2 s-1) and low cupric ion concentration ([Cu2+] = 0.16 pM; solid black triangles), (2) high light intensity (500 μmol quanta m-2 s-1) and a higher cupric ion concentration ([Cu2+] = 16 pM; open triangles), (3) intermediate light intensity (160 μmol quanta m-2 s-1) and low copper ([Cu2+] = 0.16 pM; green squares), and (4) low light intensity (50 μmol quanta m-2 s-1) and low copper ([Cu2+] = 0.16 pM; blue diamonds). The thick solid line on the x-axis shows the region where iron hydroxides precipitate (Sunda and Huntsman, 1995). Within this region [Fe′] should no longer continue to increase and the x-axis values indicate proportional increases the total iron concentration.
