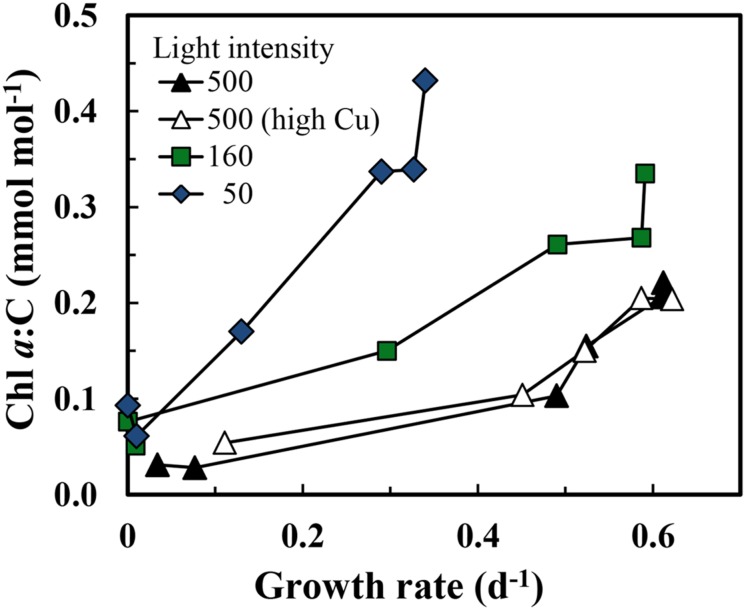
FIGURE 5.
Relationships between cellular Chl a:C ratio and specific growth rate in iron-limited and iron-sufficient cells grown at the three light intensities: 500, 160, and 50 μmol quanta m-2 s-1. The treatments and symbols are defined in brief on the figure and in detail in the legend of Figure 1.

