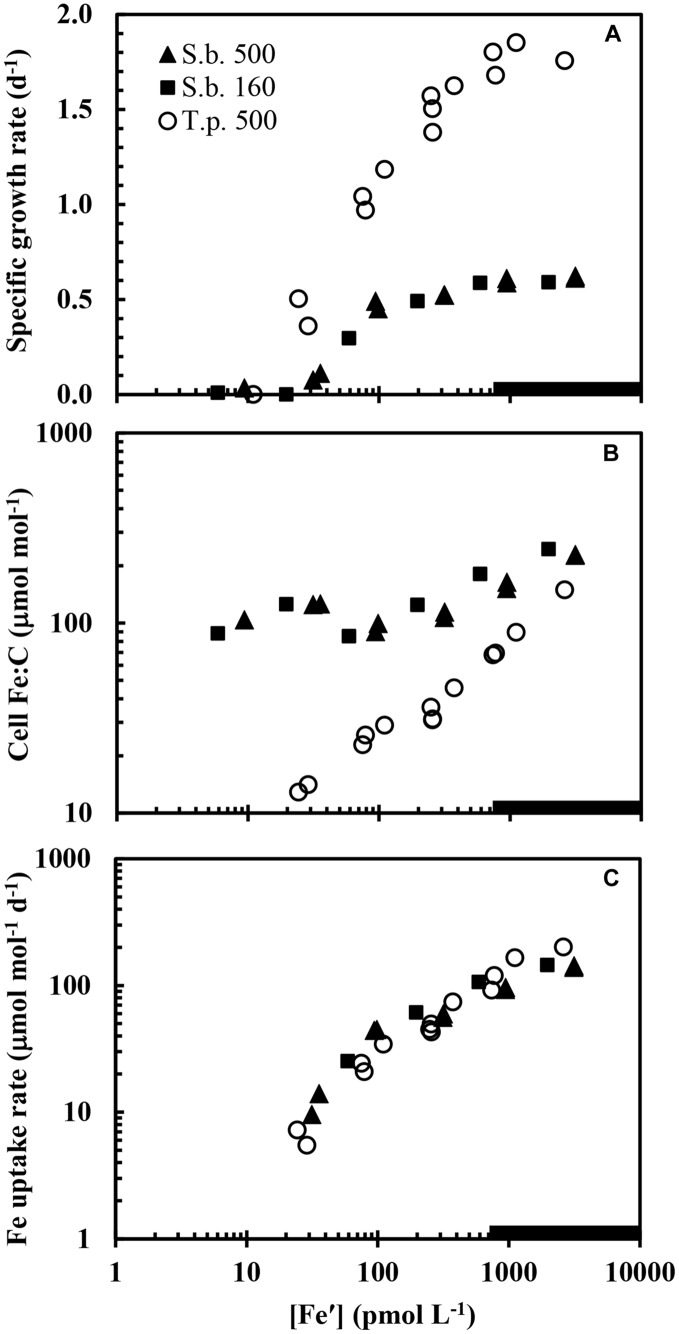
FIGURE 6.
Comparison of (A) specific growth rate, (B) cellular Fe:C, and (C) the cellular iron uptake rate normalized to cell carbon in S. bacillaris in the present study at the two higher light intensities (500 and 160 μmol quanta m-2 s-1; solid triangles and squares, respectively) and in the coastal diatom T. pseudonana in previous experiments (Sunda and Huntsman, 2011) measured at high light intensity (500 μmol quanta m-2 s-1; open circles) and the same temperature and photoperiod. Data for S. bacillaris at high light (500 μmol quanta m-2 s-1; solid triangles) are for both low Cu and high Cu cultures ([Cu2+] = 0.16 and 16 pM, respectively).

