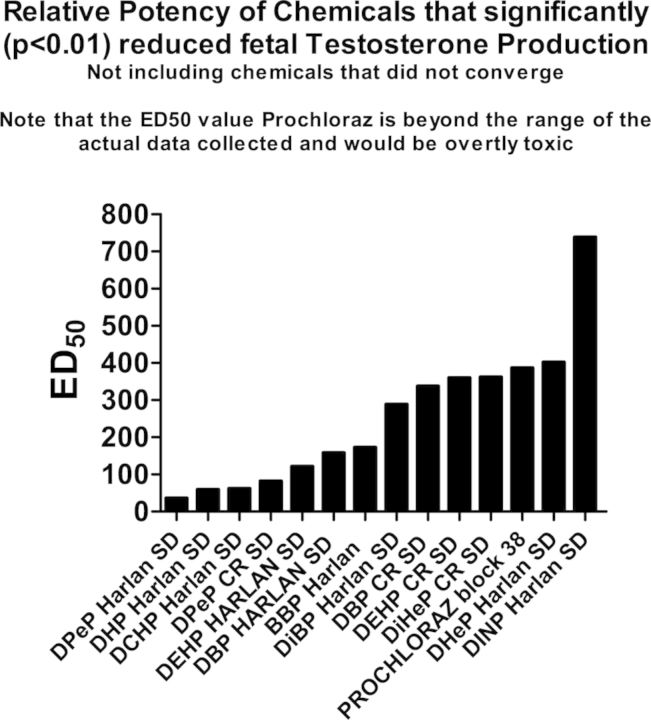
FIG. 3.
The ED50 values from the logistic regression analyses of the dose-response data were ranked from left to right by decreasing potency to reduce testosterone production with the most potent chemical with the lowest ED50 value on the left and the weakest chemical. Chemicals that did not significantly reduce testosterone production are not included in the figure.

