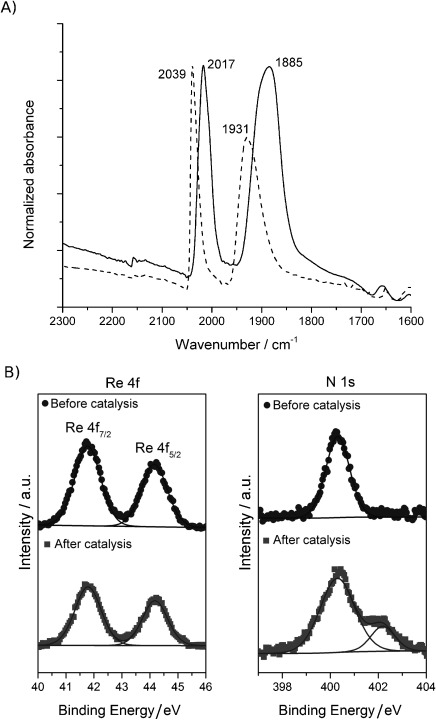
Figure 2.

A) ATR-IR spectrum of RePpic–TiO2 before and after 24 h of λ>420 nm irradiation in DMF/TEOA 5:1 under CO2. Spectrum after 24 h normalised to the maximum of the 0 h spectrum.; B) RePBr–TiO2 XPS signals for Re before (circles, 1.08 %) and after (squares, 0.82 %) and for N before (circles, 2.74 %) and after (squares, 4.19 %) catalysis (2 h, λ>420 nm in 5:1 DMF/TEOA, under CO2).
