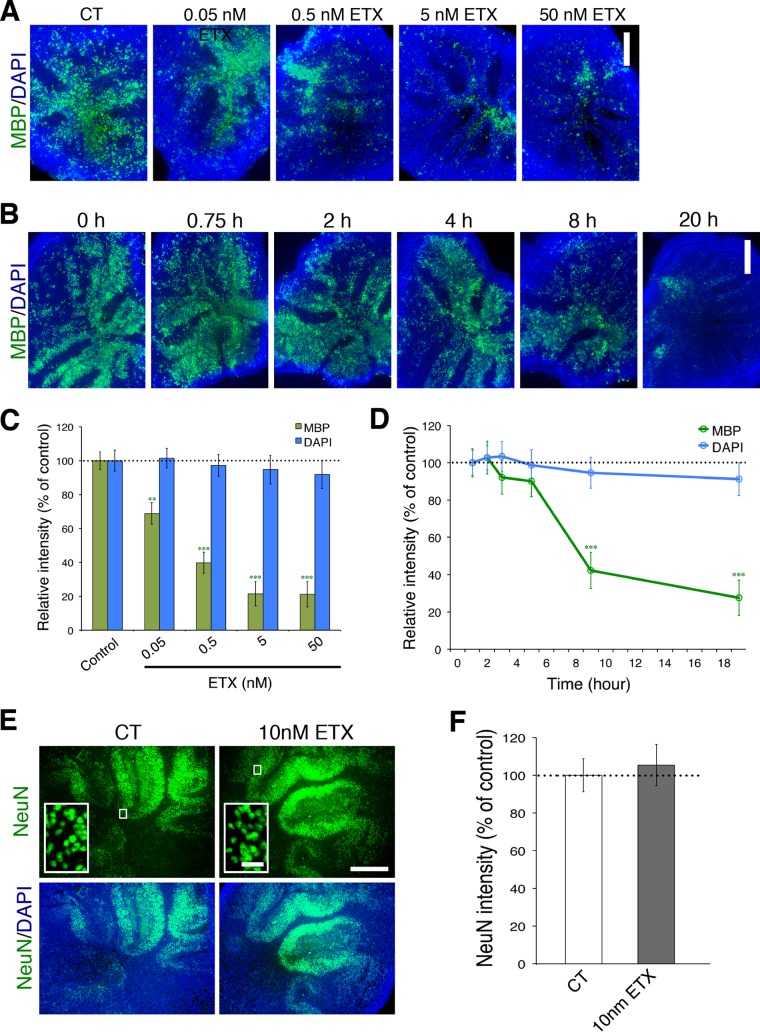
FIG 3 .
ε-Toxin treatment causes demyelination in cerebellar slice culture. ε-Toxin exposure leads to dose-dependent loss of MPB immunostaining. (A and C) Representative images (A) and quantification (C) of MBP immunostaining (green) and DAPI (blue) when the slices were treated with the indicated concentrations of ε-toxin for 20 h. DAPI (blue) was used to visualize nuclei. ε-Toxin exposure leads to time-dependent reduction of MBP immunostaining. (B and D) Representative images (B) or quantification (D) of MBP and DAPI immunostaining when the slices were treated with 5 nM ε-toxin for the indicated time points normalized to the values for untreated controls (CT or 0 h) (100%). ε-Toxin treatment does not reduce the number of neurons in slice culture. (E and F) Representative images (E) and quantitation (F) of NeuN immunostaining (green) when the slices were treated with 10 nM ε-toxin for 20 h. Results are normalized to the values for untreated controls (100%). The insets in the NeuN row of images show the regions at low magnification in corresponding conditions at a higher magnification to illustrate the nuclear staining pattern of NeuN, a neuronal marker. Values in panels C, D, and F are means ± standard errors of the means (SEM) (error bars). Values that are significantly different by two-tailed Student’s t test are indicated by asterisks as follows: **, P < 0.01; ***, P < 0.001. There were five to eight slices for each condition. Similar results were obtained in at least two independent experiments. Bars, 500 µm (for low-magnification views) and 10 µm (insets).

