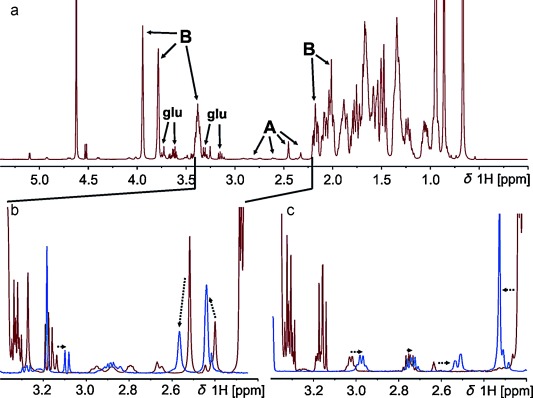
Figure 2.

a) 1D 1H NMR spectrum of azithromycin dihydrate in a 50 mm sodium cholate solution. All intense peaks belong to bile (annotated with B), whereas only a small gap from 2.2–3.4 ppm is open for analysis of the small macrolide signals (labeled A). b) Zoom into the region between 2.2–3.4 from the spectrum above (red) and, for comparison, in blue: free azithromycin in HBSS. The dotted arrows indicate shifts from free to bile-bound azithromycin. c) Zoom in the same region, but of azithromycin aglycone in the absence (blue) and presence (red) of 100 mm sodium cholate. Signals of glucose (from Hank’s buffer) are labeled glu.
