
Figure 4.
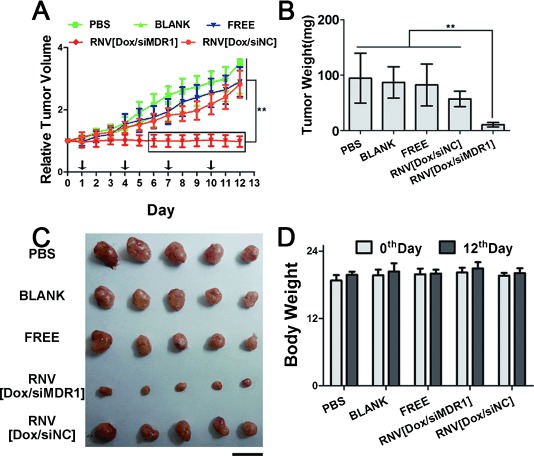
In vivo anti-tumor effects on a multi-drug resistant tumor model. A) Measurement of relative tumor volume growth after treatment. The day before the first dose is specified as day 0. The black arrow on the axis shows the day of administration. B) Weight of the excised tumors. C) Photo of the excised tumors. Scale bar, 1 cm. D) Body weight of the mice before and after the administration. *P<0.05, **P<0.01, siNC: negative control siRNA.