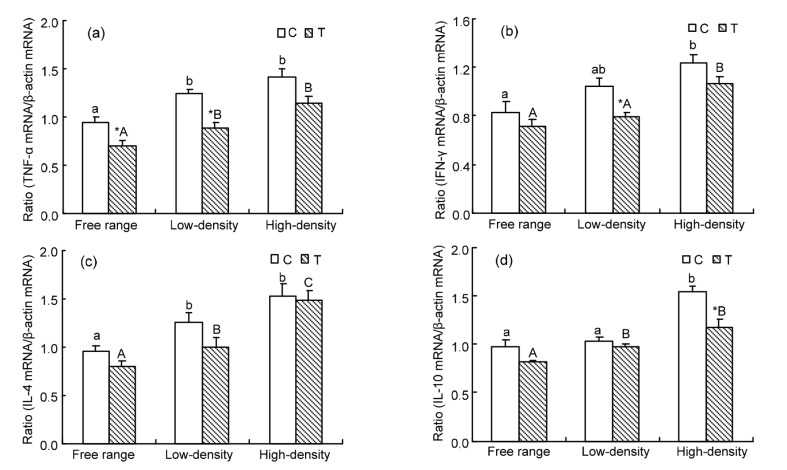
Fig. 4.
Changes in TNF-α (a), IFN-γ (b), IL-4 (c), and IL-10 (d) gene expression in oviducts of laying hens housed in different conditions
The expression levels of each gene were determined by real-time RT-PCR, and the expressed RNA levels were normalized to β-actin as a ratio of the gene of interest/β-actin mRNA levels. Data are presented as mean±SEM (n=10). * Significant difference between control and treatment groups in the same rearing pattern (P<0.05). The means not sharing a common letter are significantly different (small letters for control groups and capital letters for treatment groups; P<0.05)

