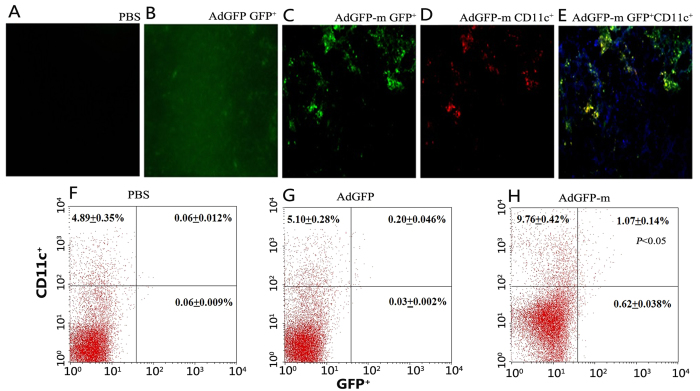
Figure 3. Uptake of adenovirus expressing GFP by DCs in the spleen.
Mice were treated i.p. with PBS, AdGFP (B) and AdGFP-m (C-E). Three days later, frozen sections of the spleen were stained with a PE-labelled mAb to CD11c and imaged using a fluorescence microscope to determine co-expression of GFP and PE. The PBS group (A) was GFP-negative and the AdGFP group (B) displayed a non-specific GFP signal. However, cells in the spleen of mice immunized with AdGFP-m displayed both green (C) and red (D) signals and had a morphology consistent with DCs. Cells expressing GFP colocalized with CD11c (E). In parallel, the splenocyte suspensions were prepared and examined by flow cytometry three days after harvesting. The proportion of cells co-expressing GFP and PE in the AdGFP-m group (H) was significantly higher than that in the PBS (F) and AdGFP group (G) (p < 0.05, chi-squared test).

