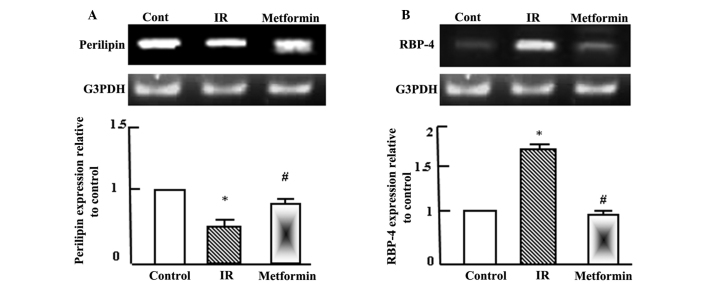
Figure 3.
Semi-quantitative reverse transcription-polymerase chain reaction (RT-PCR) analysis of (A) perilipin and (B) RBP-4 expression in adipose tissue of the control, IR and metformin-administered rats. RNA was extracted, reverse transcribed (1 mg) and RT-PCR analysis was conducted to assess perilipin and RBP-4 expression, as described in the materials and methods. Densitometric analysis was conducted for three independent experiments, and data are presented as the mean ± standard error for the three independent experiments. *P<0.05, vs. control; #P<0.05, vs. IR group. IR, insulin resistance; RBP-4, retinol binding protein-4; G3PDH, glyceraldehyde-3-phosphate dehydrogenase.

