
Figure 3.
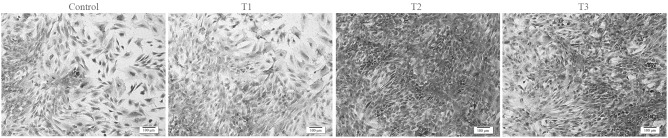
Hematoxylin-eosin staining images show the morphology of the chondrocytes cultured in vitro with 0 (control), 0.0625 (T1), 0.125 (T2) and 0.25 mmol/l (T3) protocatechuic acid for six days (cell seeding density, 2×10⁴/ml; original magnification, ⅹ100; scale bar, 100 µm).