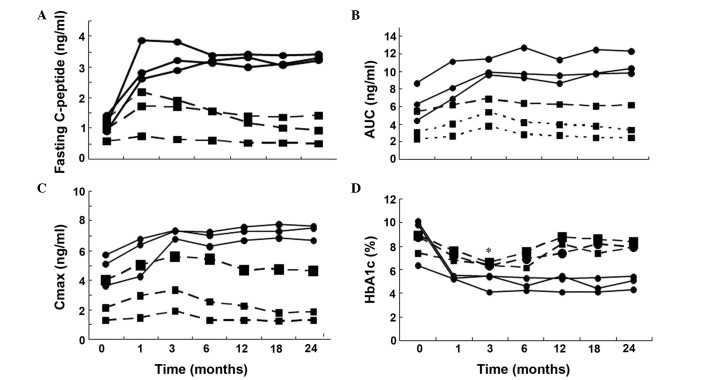
Figure 3.
Time course of (A) fasting C-peptide, (B) AUC, (C) Cmax and (D) HbA1c in the six type 2 diabetes patients. The x-axis represents the time-course relative to the transplantation of umbilical cord mesenchymal stem cells. AUC, area under the curve (C-peptide); Cmax, peak concentration (C-peptide); HbA1c, glycated hemoglobin. Black circles, patients avoiding insulin injection after the cellular therapy during the follow-up period (defined as insulin-free patient). Black squares, patients requiring reduced-dose of insulin injection after the cellular therapy (defined as insulin-dependent patient). (A-C) All black circle points are P<0.05 vs. month 0 (pretreatment) for the insulin-free patients. (D) All black square points are P<0.01 vs. month 0 (pretreatment) for the insulin-dependent patients with the exception of * (month 3) which is P<0.05 vs. month 0 (pretreatment).

