. 2015 May 29;4:e07410. doi: 10.7554/eLife.07410

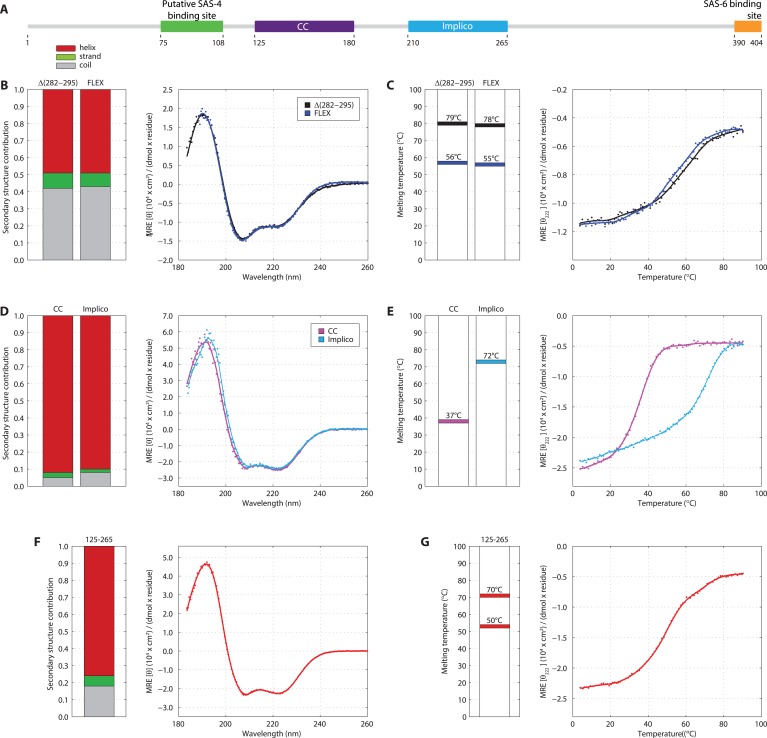
Figure 1. SAS-5 comprises two independently folded domains.

(A) Schematic representation of SAS-5 architecture showing the relative locations and residue boundaries of the coiled-coil and Implico domains, the putative SAS-4 binding site (Hatzopoulos et al., 2013) and the SAS-6 binding site (Qiao et al., 2012; Hilbert et al., 2013). (B) Overlaid CD spectra of SAS-5Δ282–295 and SAS-5FLEX samples recorded at 10°C, shown as per residue molar elipticity vs wavelength. The semi-quantitative contribution of secondary structure elements in each spectrum is deconvoluted in the bar charts on the left. Grey color corresponds to random coil, green to β-strand and red to α-helical segments. (C) Thermal unfolding profiles of the same samples monitored by recording molar elipticity at 222 nm as a function of temperature, and graphical representation of the melting transition temperatures observed in each sample. (DG) Similar CD spectra and thermal unfolding profiles of (D,E) SAS-5CC and SAS-5Imp, and (F,G) SAS-5125–265 samples.

DOI: http://dx.doi.org/10.7554/eLife.07410.003

Figure 1.

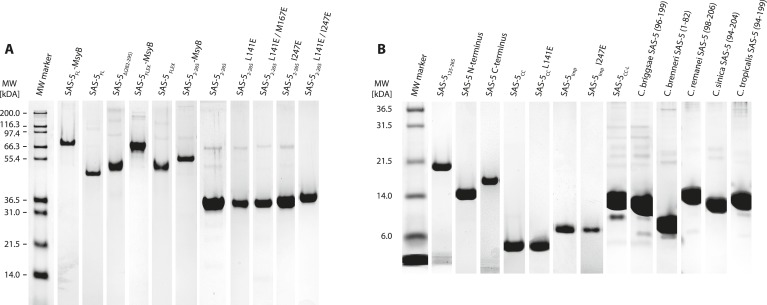
Figure 1—figure supplement 1. Recombinant proteins sample quality.

Figure 1—figure supplement 1.

(A,B) Sections of SDS-PAGE showing Coomassie-stained samples of recombinant proteins used in this study. Panel A groups proteins with molecular weight over 30 kDa; panel B shows smaller proteins. Individual gel sections have been compressed or expanded along the vertical axis to match the molecular weight marker, and their contrast levels have been equalized.
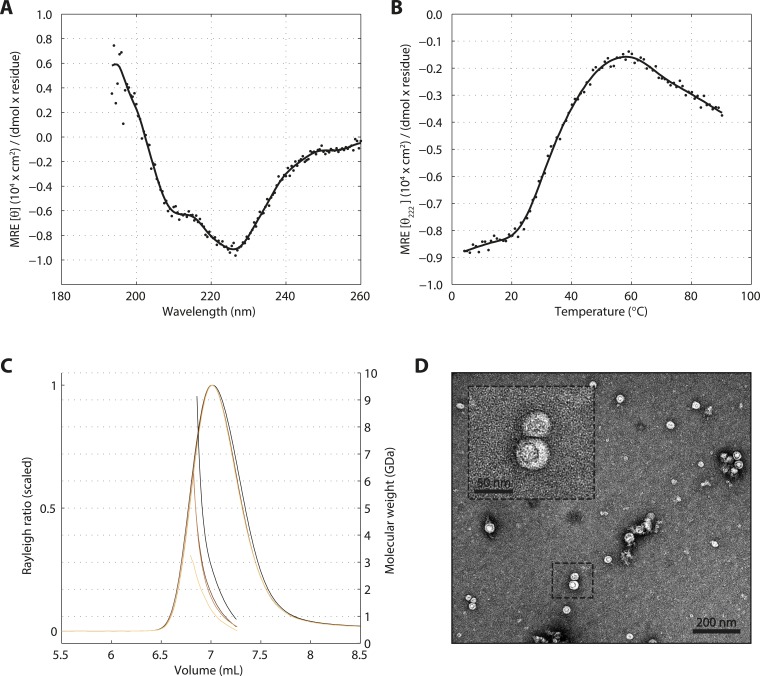
Figure 1—figure supplement 2. SAS-5 forms protein aggregates in vitro.

Figure 1—figure supplement 2.

(A) CD spectrum of SAS-5FL at 10°C shown as per residue molar elipticity against wavelength, and (B) thermal unfolding profile of the same protein monitored by recording molar elipticity at 222 nm as a function of temperature. The CD spectrum is highly similar to that of protein aggregates characterized elsewhere (Digambaranath et al., 2010). (C) Overlay of SEC-MALS chromatograms of SAS-5FL samples at multiple concentrations, showing scaled light scattering intensity vs elution volume. (D) Representative negative stain electron micrograph of SAS-5FL and high-magnification view of the boxed section.
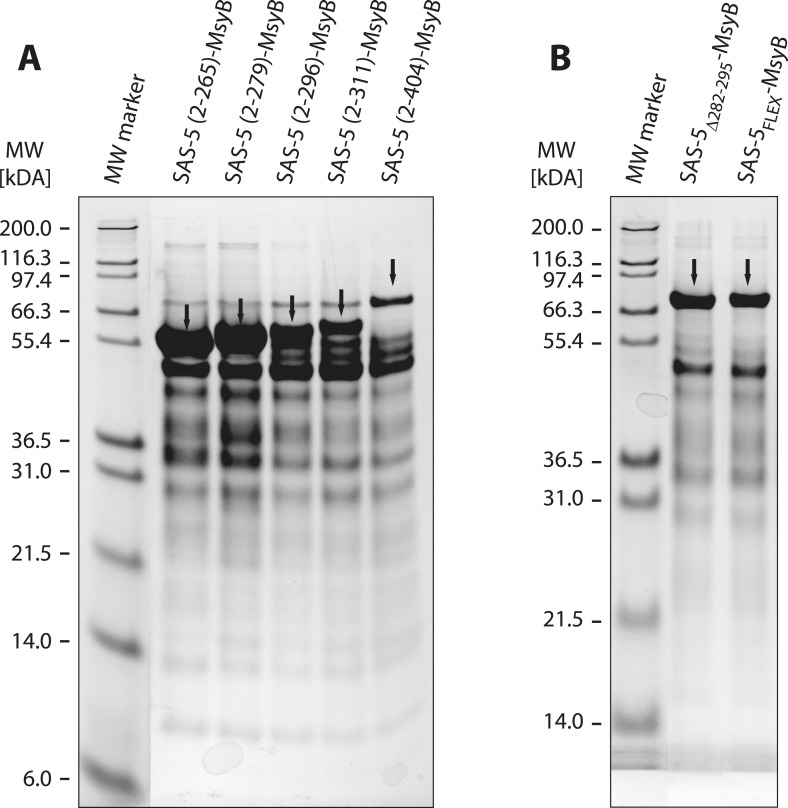
Figure 1—figure supplement 3. A short SAS-5 segment promotes protein aggregation.

Figure 1—figure supplement 3.

(A, B) Coomassie-stained SDS-PAGE of metal-affinity purified SAS-5 variants, corresponding to MsyB-tagged full-length protein and C-terminal truncations (A). The expected SAS-5-MsyB protein bands are indicated by black arrows. Soluble protein yields increased significantly upon truncation of residues 280–296 (compare lanes 3 and 4). Excision of this protein segment (SAS-5Δ282–295-MsyB) or substitution by a flexible linker (SAS-5FLEX-MsyB) improved soluble yields of the full-length protein (B, compare to right-most lane of panel A).
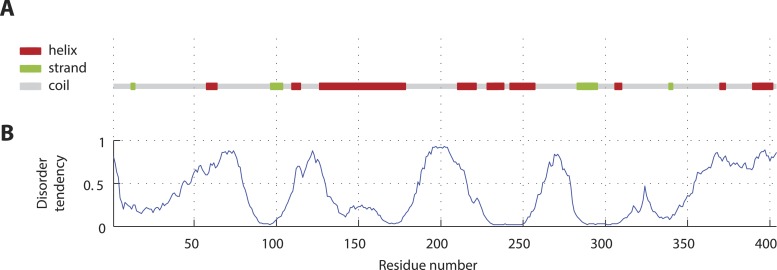
Figure 1—figure supplement 4. SAS-5 secondary structure and disorder predictions.

Figure 1—figure supplement 4.

(A) Schematic representation and relative locations of secondary structure elements predicted from the SAS-5 amino acid sequence by PSIPRED (Jones, 1999). (B) Disorder probability per amino acid residue predicted from the SAS-5 sequence by DISOPRED3 (Jones and Cozzetto, 2014).
Figure 1—figure supplement 5. The SAS-5 N- and C-terminal segments are unstructured in isolation.

Figure 1—figure supplement 5.

(A) Overlaid CD spectra of SAS-5 N-terminal (residues 2–122) and C-terminal (residues 269–404) fragments recorded at 10°C. The semi-quantitative contribution of secondary structure elements in each spectrum is deconvoluted in the bar chart left. Grey colour corresponds to random coil, green to β-strand and red to α-helical segments. (B) Thermal unfolding profiles of the same samples based on their CD signal at 222 nm.