
Figure 2.
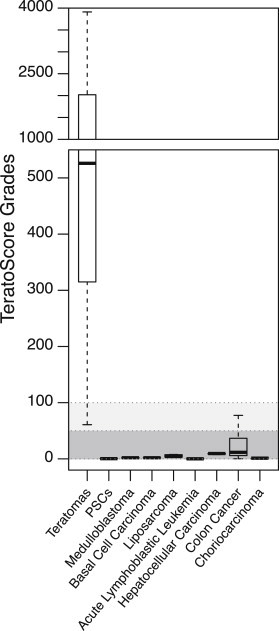
TeratoScore Grades of Different Tumors and PSCs
TeratoScore grades were calculated as the multiplication of the mean lineage gene expression of each tumor divided by 1,000. While teratomas show high and diverse TeratoScore grades (n = 14, mean = 1,186, SEM = 334), all other tumors and PSCs produce significantly lower ones (n = 34, mean = 7.3, SEM = 2.6, p < 10−6).