
Figure 2.
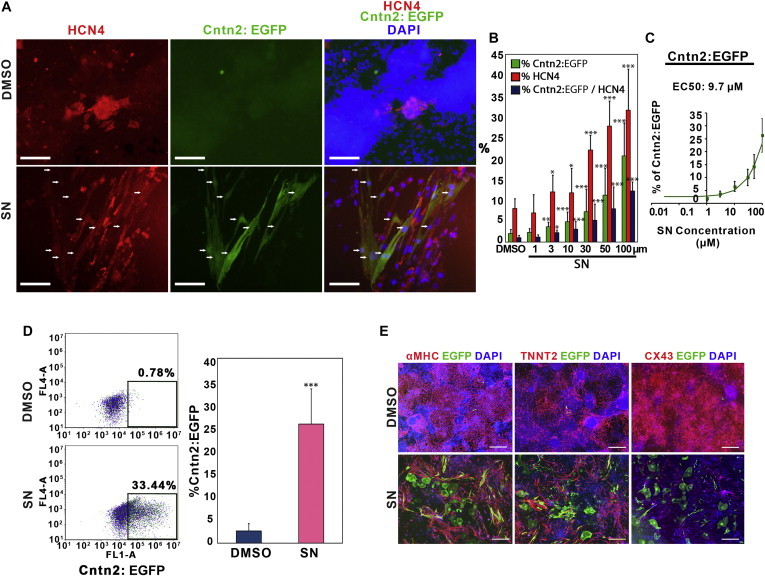
Sodium Nitroprusside Enhances Generation of Cardiac Conduction System Cells
(A) Expression of cardiac conduction system markers, HCN4 and Cntn2:EGFP, was examined by immunofluorescence staining using antibodies against either HCN4 or GFP. Scale bar, 200 μm. DMSO was used as a control. Arrows indicate cells that are double positive deriving from the SN-treated cultures.
(B) Quantification of immunofluorescence staining of HCN4+, Cntn2:EGFP+, and HCN4+/Cntn2:EGFP+ double-positive cells by MetaExpress image analysis. Results represent the combined data from three independent differentiation experiments. Error bars show SD.
(C) Efficacy curve of SN in the Cntn2:egfp cell line. Results represent the combined data from three independent differentiation experiments. Error bars show SD.
(D) Flow Cytometry analysis of Cntn2:EGFP expression. Following 5 days treatment of either SN or DMSO, cells were harvested at day 25 of differentiation. Quantification of Cntn2:EGFP expression is shown in the right panel. Results are from five independent experiments. Error bars show SD.
(E) SN- or DMSO-treated cells co-express cardiomyocyte markers αMHC or TNNT2 with Cntn2:EGFP. Cntn2:EGFP+ cells express relatively weak levels of CX43 (right panel). Scale bar, 200 μm.
Asterisks indicate significant differences compared with DMSO. Statistical significance is indicated: ∗p < 0.05, ∗∗p < 0.01, ∗∗∗p < 0.001. See also Figure S2.