
Figure 5.
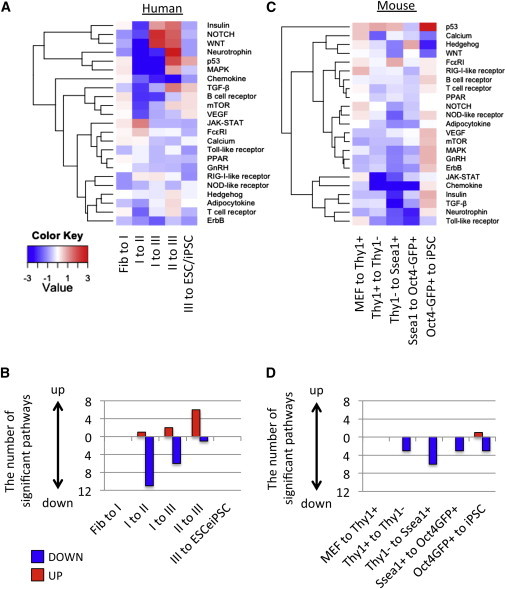
Biphasic Change of Signaling Pathways during hiPSC Reprogramming
(A and B) GSEA of signaling pathways (A) between distinct human intermediate stages and (B) between distinct mouse intermediate stages.
(C and D) The count of significantly upregulated (red) or downregulated (blue) pathways in (C) human and (D) mouse iPSC reprogramming.
See also Figure S4.