
FIG. 2.
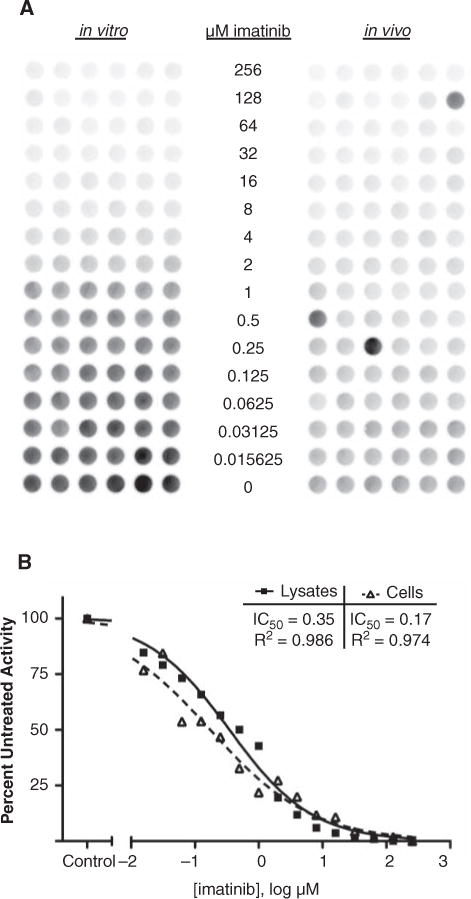
Imatinib dose responses in vitro and in vivo. (A) In vitro kinase assays were performed with a 2-fold dilution series of imatinib (256-0.015625 μM) added to K562 lysates during the kinase reaction. In vivo kinase assays were performed with lysates from cells that had been treated for 1 h with an identical dilution series of imatinib prior to lysis. The resulting phosphorylated Abltide was probed with antiphosphotyrosine and visualized with Amplex Red fluorescence. The image was obtained and analyzed using Bio-Rad QuantityOne software. (B) The IC50 curve was calculated for the in vitro and in vivo treatments in GraphPad Prism (v5.01) using the median from each dilution as quantified in QuantityOne. R2 represents the correlation of the data.