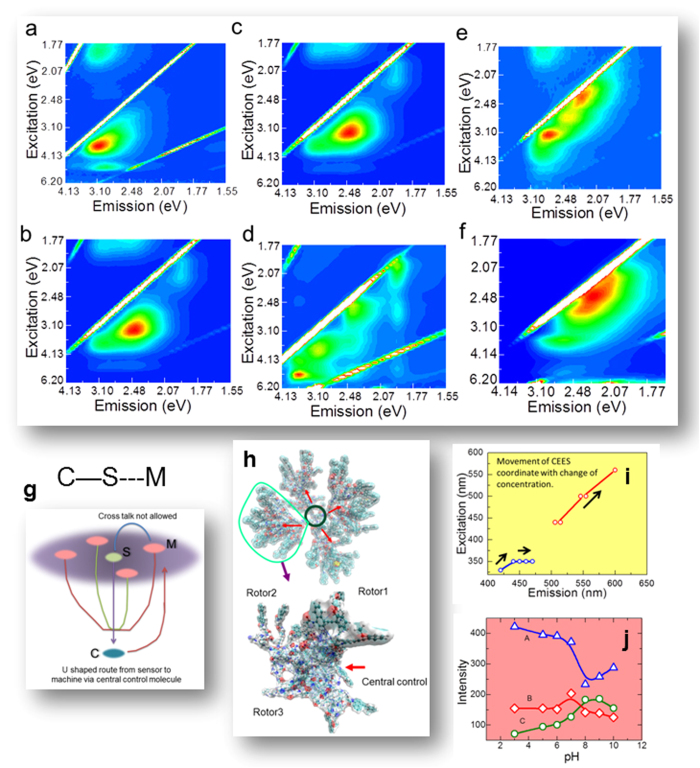
Figure 2.
(a-f) (a) CEES spectrum for the PAMAM; (b). CEES spectrum for the NR-PAMAM; (c). CEES spectrum for NR-PAMAM; (d). CEES spectrum for PAMAM-NR-NIR797; (e). CEES for PAMAM-NR-MM; (f). CEES spectrum for PAMAM-NR-NIR797-MM. Note that these data are density and pH dependent. (g). Schematic shows CS and MC dual path (h) Potential surface of PCMS. One lobe is zoomed below. (i) Peaks variation with density from 2 mg/mL to 10mg/mL (j) Peaks variation from pH. 2 to PH 12.

