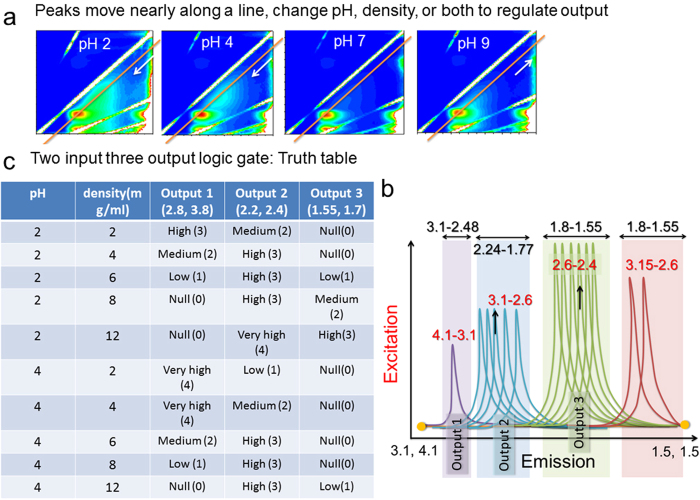
Figure 3. CEES, left to right pH 2, 4, 7, 9; density 2 mg/mL, a line is drawn parallel to Raman ridge where peaks move, scale same as.
(a) Fig. 2a–f. (b). Schematic of peaks motion paths, shows 14 locations along the line Fig. 3a (c) Two input three output logic gate: truth table.

