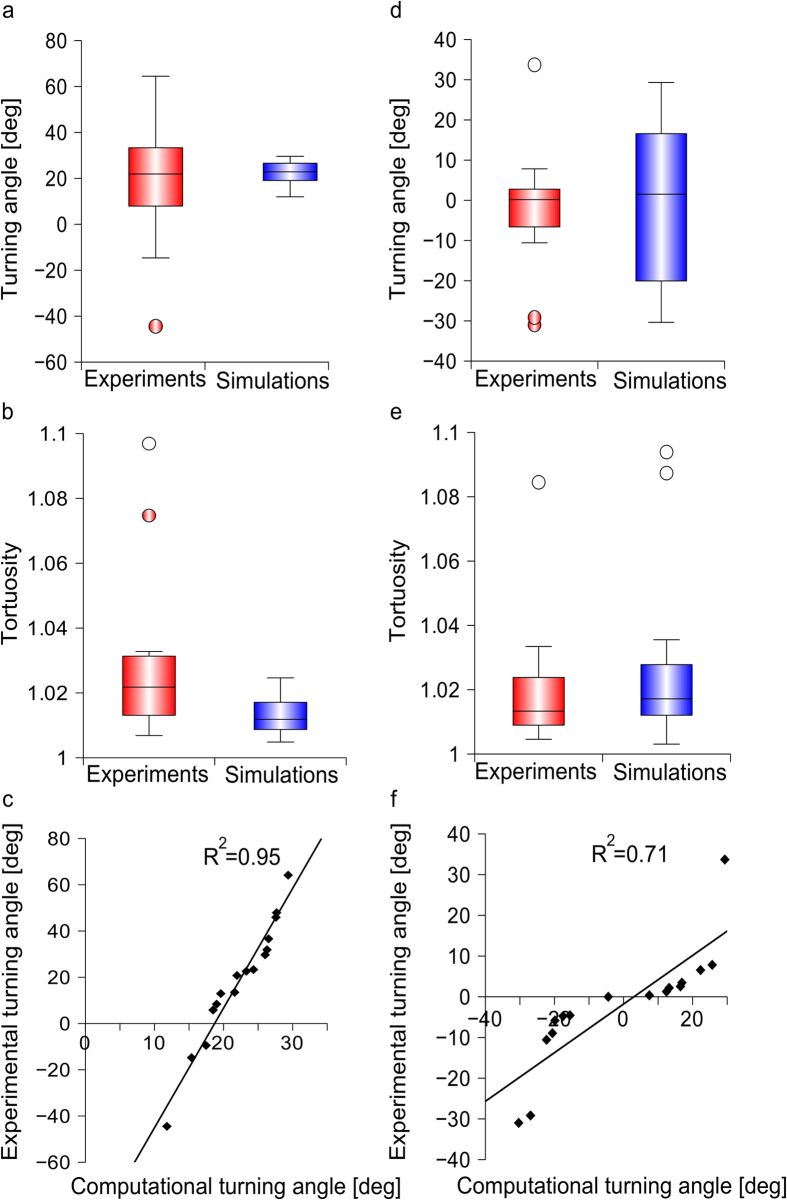
Figure 2. Assessment of in silico model performance for chemoattractive turning and control conditions.
The explicit paths of in silico growth cones were measured in presence of an attractive netrin gradient and compared with the biological ones: (a) the difference between turning angles for experimental44 and simulated axons (n = 16 axons, for each set) was not statistically significant. (b) The difference between tortuosity of experimental44 (n = 10) and computational (n = 16) traces was not statistically significant. (c) Computational distribution of turning angles plotted versus experimental results44 (n = 16 samples for each case): a linear relationship was found (R2 = 0.95). Similarly, the explicit paths of in silico growth cones were measured in control conditions and compared with biological results: (d) turning angles for experiments44 and simulations (n = 16, for each set) were not significantly different. (e) Tortuosity values for experimental44 (n = 7) and simulated (n = 16) trajectories were not significantly different. (f) Computational distribution of turning angles plotted versus experimental results44 (n = 16 samples for each case): a linear relationship was found (R2 = 0.71).

