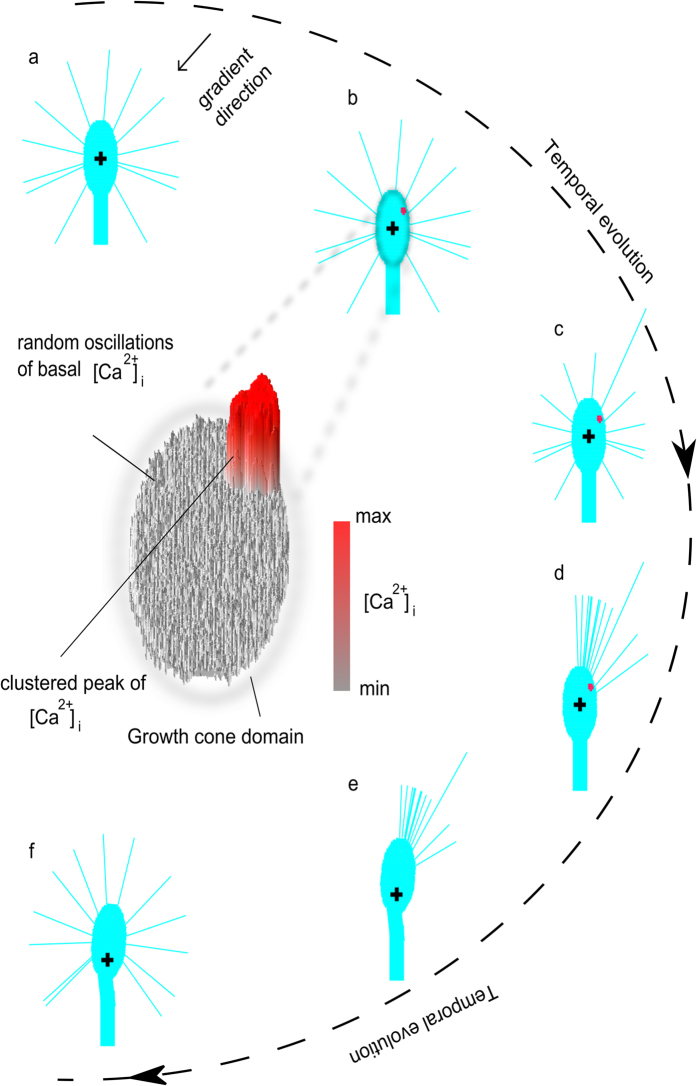
Figure 8. Temporal evolution of the turning response of in silico growth cones.
The temporal evolution (external dotted line) of an in silico growth cone exposed to an attractive gradient was shown (the arrow showed the gradient direction, see (a)). In particular, a cluster of activator (intracellular calcium) arose within the growth cone side facing the external gradient (b). Random oscillations of the basal intracellular calcium together with the calcium peak were shown within the growth cone domain (central magnification of b). (c–f) The position of the intracellular calcium peak influenced the choice of leading filopodium that guided the growth cone advance. In all CX3D images, the black cross indicates the growth cone barycentre at the beginning of assay.

